Exploring TradingView Indicators for Enhanced Trading Strategies


When it comes to finance, investing, and crypto, TradingView is a great tool for traders and investors seeking to harness analytics and charts to sharpen their market strategies. This platform blends sophisticated charting capabilities with real-time market data, offering an unparalleled suite of resources to navigate the complexities of trading.
With its rich library of indicators and a collaborative community spirit, TradingView provides traders with valuable insights, fostering informed decision-making and strategy refinement across diverse markets, including stocks, forex, and cryptocurrencies.
Engaging with TradingView means tapping into a world where data-driven analysis meets communal wisdom, providing a foundation for accurate trading and success.
TradingView stands as a comprehensive platform designed for traders and investors, combining advanced charting tools, a vast array of technical indicators, and an engaged community where users exchange trading insights. It caters to various financial markets, including stocks, forex, cryptocurrencies, and more, offering real-time data and a suite of analytical tools to facilitate informed trading decisions.
TradingView’s advanced indicators have helped millions of investors navigate market volatility, identify entry and exit points, and generate buy and sell signals.
The platform’s collaborative environment is bolstered by features that allow users to share and discuss strategies, enhancing the collective trading wisdom. With its user-friendly interface and integration of market data, TradingView supports traders in crafting and refining their trading strategies, making it a pivotal tool in the financial community’s toolkit.
For a more detailed exploration of TradingView’s features and community, visit their official site.
TradingView indicators are pivotal for those delving into technical analysis, serving as sophisticated algorithms that sift through market data to unearth trading signals. These indicators range from the simplicity of moving averages to the complexity of the Relative Strength Index (RSI) and Volume Weighted Average Price (VWAP), aiding traders in deciphering market trends, potential reversal zones, and critical support and resistance levels.
The diversity of indicators available on TradingView enables traders to apply a myriad of analytical techniques to their strategies, making it an essential tool for anyone looking to leverage technical analysis for market predictions. Whether it’s for day trading, swing trading, price action trading, or any other strategy, traders can use TradingView for custom indicators to improve accuracy and success.
A key feature of TradingView is the broad accessibility of its analytical tools. The platform offers a wide array of indicators free of charge, allowing traders to apply diverse technical analysis methods without the need for a premium subscription.
While some of the more advanced features and indicators may be gated behind a paywall, TradingView’s free tools provide substantial value, enabling traders to enhance their strategies and conduct in-depth market analysis.
This approach democratizes access to advanced financial tools, enabling traders at all levels to utlilize the best indicators, and explore sophisticated analytical techniques without a significant financial outlay.
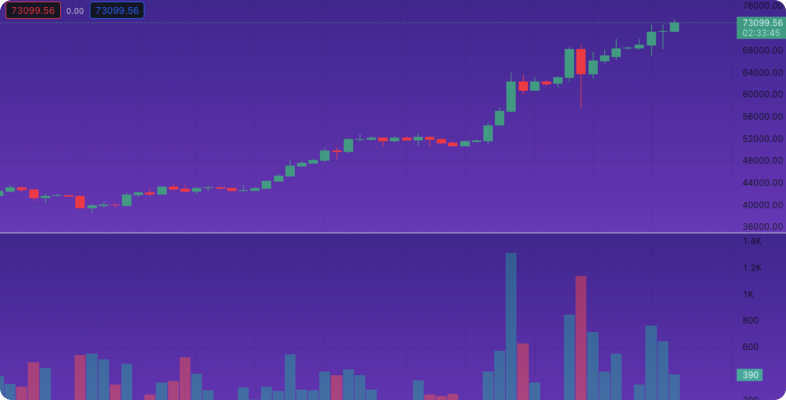
The Volume Indicator is a technical analysis tool used to measure the number of shares or contracts traded within a specified period. It provides insights into the strength and direction of price movements based on trading volume. Unlike other indicators that focus solely on price action, the Volume Indicator considers the significance of trading activity, offering a holistic view of market dynamics.
The Volume Indicator plots volume bars or lines beneath the price chart, depicting the total volume traded at each price level or during each time interval. High volume typically accompanies significant price movements, indicating strong market participation and confirming the validity of price trends. Conversely, low volume may signal indecision or lack of conviction among traders, potentially leading to trend reversals or consolidation.
By analyzing volume patterns, traders can gauge market sentiment and identify potential trend reversals or continuations. Surges in volume often precede price breakouts or breakdowns, providing early signals for traders to enter or exit positions. Additionally, divergence between price movements and volume trends can highlight discrepancies, prompting traders to exercise caution or adjust their trading strategies accordingly.
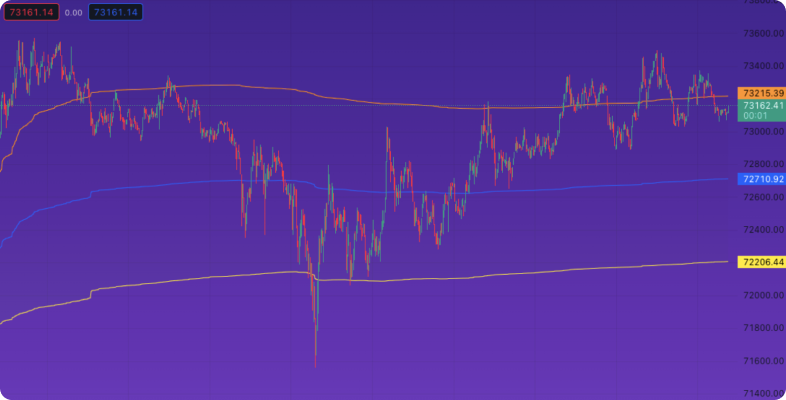
The Volume Weighted Average Price (VWAP) is a free indicator on TradingView that blends price and volume information to yield a cumulative average price, attributing greater significance to price levels associated with higher trading volumes.
Represented as a singular line across the chart, it offers traders a benchmark to determine whether the current price is above or below the average market price. This insight is invaluable for discerning trend directions and potential reversal points, rendering VWAP an indispensable instrument for diverse trading approaches, from intraday to positional trading.
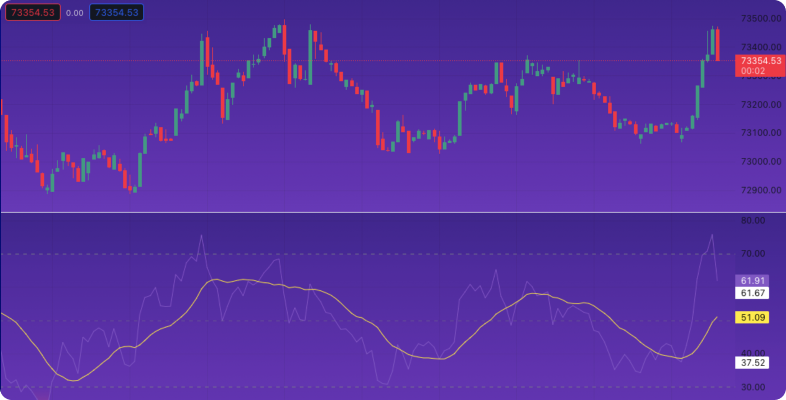
The Relative Strength Index (RSI) stands out as a momentum-based oscillator within TradingView’s arsenal, dedicated to evaluating the pace and magnitude of price alterations to spot overbought or oversold market territories.
With its range set between 0 to 100, readings surpassing 70 signal overbought conditions, whereas those under 30 suggest oversold scenarios. Traders harness the power of RSI to strategize their market entries and exits, particularly by monitoring for the indicator to retreat from these extremities, which could herald impending price direction reversals.
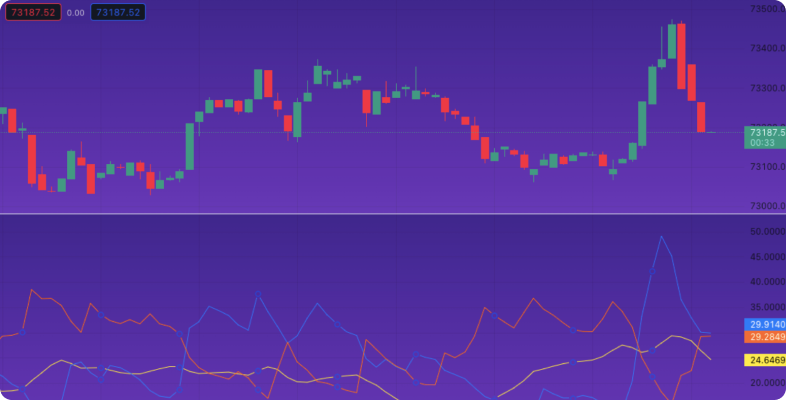
The Directional Movement Index (DMI) emerges as a key analytical component on TradingView, tasked with scrutinizing both the direction and vigor of prevailing price trends. Comprising three distinct lines – ADX, DMI+, and DMI-, it offers a comprehensive view where ADX quantifies trend strength irrespective of its direction, while DMI+ and DMI- delineate upward and downward trends respectively.
Traders lean on DMI to gauge the robustness of trends and spot potential shifts in market momentum, with ADX elevations hinting at intensifying trends and DMI+ and DMI- crossovers suggesting potential trend reversals, thus facilitating strategic trade planning.
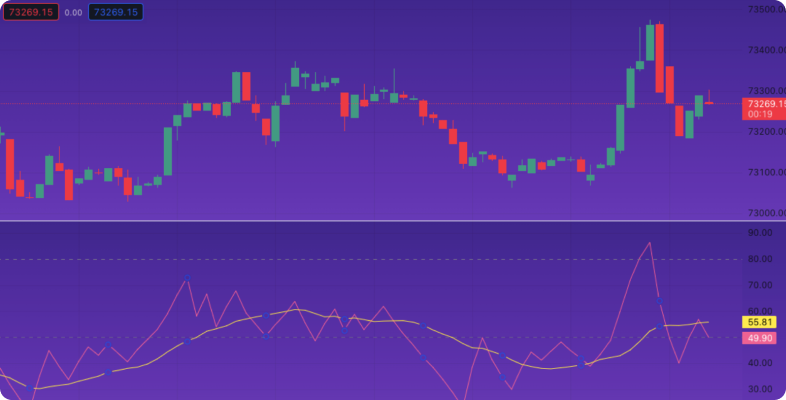
Relative Volatility is an indicator used to assess the market’s volatility by comparing current price movements to past price fluctuations over a specified period. It helps traders understand the intensity of price changes, offering a measure of market uncertainty or stability.
The indicator calculates the degree of price variation relative to a historical average. High relative volatility index indicates significant price changes, suggesting increased market activity or news impacts. Conversely, low volatility points to a more stable and less turbulent market environment.
By providing insights into market volatility, it aids traders in adjusting their strategies to current market conditions. High volatility may present more trading opportunities but with higher risk, while low volatility signals a potentially steadier market, guiding traders on when to enter or exit trades and set risk management parameters.

The Average True Range (ATR) is a technical analysis tool that measures market volatility by decomposing the entire range of an asset price for that period.
ATR calculates the average of true ranges over a specified period. A “true range” encompasses the current high less the current low, the absolute value of the current high less the previous close, and the absolute value of the current low less the previous close.
ATR aids traders in understanding market volatility, which can be crucial for setting stop-loss and take-profit levels. A higher ATR value indicates greater volatility, suggesting larger price movements and potentially higher risk or reward. Traders can use this information to adjust their trading strategy according to the market’s volatility.
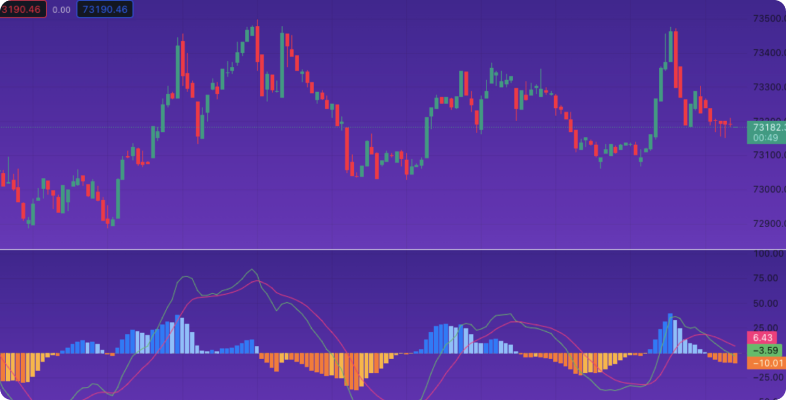
The Moving Average Convergence Divergence (MACD) is a popular momentum indicator used to identify trend direction, momentum strength, and potential trend reversals. It consists of two moving averages – the MACD line and the signal line – and a histogram representing the difference between the two lines. Traders often use MACD to confirm trends, spot divergences, and generate buy or sell signals.
The MACD line is calculated by subtracting the longer-term exponential moving average (EMA) from the shorter-term EMA. The signal line, typically a 9-period EMA of the MACD line, serves as a trigger for buy or sell signals. The histogram displays the difference between the MACD line and the signal line, providing visual cues about momentum shifts.
MACD helps traders identify potential trend changes and confirm existing trends. When the MACD line crosses above the signal line, it generates a bullish signal, suggesting a potential uptrend. Conversely, a crossover below the signal line indicates a bearish signal, signaling a possible downtrend. Additionally, divergence between the MACD line and price movements can provide early warnings of trend reversals, allowing traders to adjust their positions accordingly.
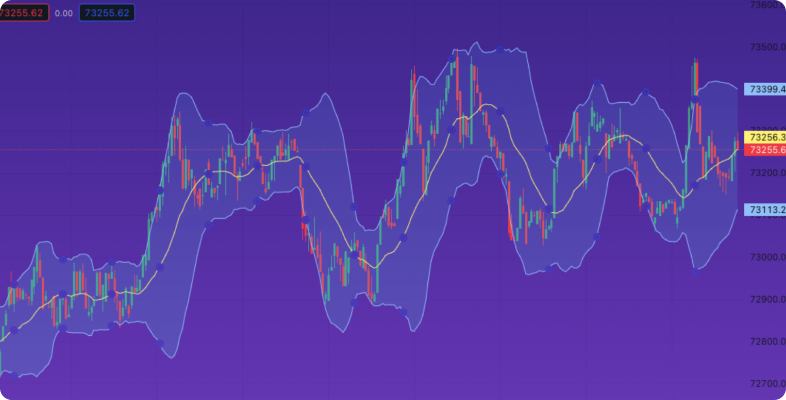
Bollinger Bands are a staple in technical analysis, representing a volatility indicator consisting of a set of three lines plotted above and below a security’s price chart. The middle line is typically a simple moving average, while the upper and lower bands adjust themselves dynamically based on market volatility, typically two standard deviations away from the moving average.
The bands expand and contract based on price volatility. In periods of high volatility, the bands widen, and during low volatility, they contract. Traders often observe the price’s interaction with the bands; when the price reaches the upper band, it may indicate overbought conditions, signaling a potential reversal, whereas touching the lower band may suggest oversold conditions.
Bollinger Bands serve multiple purposes for traders. Firstly, this indicator helps traders identify entry and exit points, with prices often bouncing off the bands. Secondly, they provide insights into market volatility, aiding in gauging the intensity of price movements. Lastly, they assist in identifying potential trend reversals or continuation patterns, offering valuable signals for traders to manage their positions effectively.
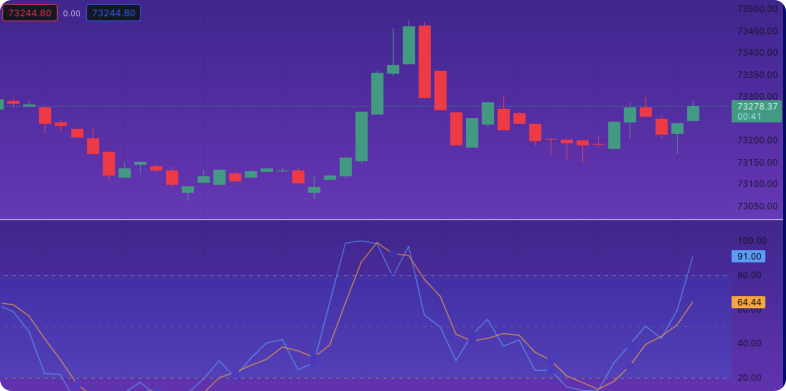
The Stochastic indicator, commonly referred to as Stochastic, is a momentum oscillator used to gauge the relative position of a security’s closing price compared to its price range over a specified period, typically 14 periods. It provides insights into potential trend reversals and continuation patterns.
Stochastic oscillates between 0 and 100, with readings above 80 indicating overbought conditions and those below 20 suggesting oversold conditions. Traders analyze the oscillator’s movements to anticipate changes in market sentiment, looking for crossovers and divergences between the indicator and price movements as potential trading signals.
The Stochastic indicator assists traders in timing their trades more effectively by identifying overbought and oversold conditions. By signaling potential reversal points, it allows traders to manage risk and improve trade execution. When combined with other technical indicators or price action analysis, Stochastic enhances the accuracy of trading signals and provides valuable insights into market dynamics.

The Chaikin Oscillator is a technical analysis tool used to measure the momentum of a security by comparing the accumulation/distribution line to its moving average. Developed by Marc Chaikin, it helps traders identify bullish and bearish signals based on the divergence between the accumulation/distribution line and its moving average.
The oscillator is calculated by subtracting a 10-day exponential moving average (EMA) from a 3-day EMA of the accumulation/distribution line. Positive values indicate bullish momentum, suggesting buying pressure, while negative values indicate bearish momentum, suggesting selling pressure.
The Chaikin Oscillator assists traders in identifying potential trend reversals and confirming the strength of current trends. By generating buy and sell signals based on the crossing of the oscillator’s zero line, it aids traders in making more informed decisions about market entries and exits. Additionally, the oscillator can be used in conjunction with other technical indicators for greater accuracy of trading signals and improve overall trading performance.
Note: You can access these with a 30-day free trial.
TradingView stands out as an indispensable tool for traders and investors alike, offering a comprehensive suite of resources to navigate the intricacies of the financial markets. From its vast library of indicators to its collaborative community environment, TradingView equips users with the tools and insights necessary for accurate and informed decision-making.
TradingView offers a diverse array of indicators, ranging from popular indicators like moving averages to lesser-known chart patterns and volume-based tools. These indicators serve as invaluable aids for traders to identify trends, potential price targets, and buy signals, catering to various trading styles and preferences.
One of TradingView’s greatest strengths lies in its accessibility and inclusivity. While some advanced features may require a paid subscription, the platform offers a wide range of free indicators that provide substantial value to traders at all levels. This democratization of access to advanced financial tools empowers traders to refine their strategies, backtest their ideas, and enhance their trading performance without significant financial outlay.
Moreover, TradingView allows traders to backtest their strategies, enabling them to assess the performance of different indicators over a certain period and refine their approaches accordingly. This feature adds another layer of accuracy and reliability to traders’ decision-making processes, enhancing their overall trading experience.
In conclusion, TradingView stands as a beacon of innovation in the realm of financial analysis, providing traders with the best TradingView indicators and a platform to collaborate, learn, and grow. Whether you’re a seasoned trader or just starting out, TradingView offers the tools and resources you need to succeed in the dynamic world of finance and investing.