Trading with the Awesome Oscillator Indicator
The Awesome Oscillator, developed by Bill Williams, is a unique market analysis tool that stems from his trading system, which is based on the notion that market movements are inherently chaotic. This indicator, often integrated into awesome oscillator trading strategies, appears as a histogram in a separate window below the main chart, with bars colored green or red, depending on the movement’s direction relative to a zero line. It calculates the difference between a 5-period and a 34-period moving average, providing insights into market dynamics without additional levels or markers.
The value of the Awesome Oscillator is calculated as the midpoint between the high and low prices, distinguishing it from other tools like the MACD, which uses close prices for its calculations. This method, created by Bill Williams—the creator of the Awesome Oscillator—offers a straightforward yet effective tool for analyzing various financial markets, from stocks to Forex and commodities.
Awesome Oscillator = SMA(5) – SMA(34)
The AO belongs to the group of oscillators, but it does not have a fixed scale.
Advantages of the Awesome Oscillator include:
- Versatility: This tool performs well in both stock and currency markets.
- Accessibility: It is readily available in most trading platforms, including mobile versions, making it easy to access without needing to search elsewhere.
- No Repainting: An essential feature for traders, as the signals it provides are permanent and do not disappear over time.
- Effectiveness: As part of Bill Williams’ trading strategy, the Awesome Oscillator has proven its effectiveness in practice, delivering reliable results in trading.
- Self-sufficiency: It independently analyzes various aspects of price movement in the market, eliminating the need for additional analytical tools.
Disadvantages of the Awesome Oscillator include:
- Signal Lag: Although it is an oscillator and should ideally provide timely signals, it does suffer from a slight delay.
- Fixed Settings: The settings embedded by the developer cannot be altered, which means it can only be used with its existing parameters.
- False Signals on Short Timeframes: When used on short time intervals, it tends to generate excessive noise, leading to false signals. This makes it less favored among day traders.
Advanced Trading Strategies with the Awesome Oscillator
Divergence Signal
The AO oscillator, developed by Bill Williams, can provide both countertrend signals and entry points aligned with the current trend. It does not specifically target either trend-following or countertrend trading exclusively. Unlike many other indicators, the Awesome Oscillator does not feature overbought or oversold zones, meaning it cannot indicate when the market is overbought or oversold.
One effective strategy using the Awesome Oscillator in trading is to look for divergences at significant levels. This method, part of the popular Awesome Oscillator trading strategies, allows traders to capitalize on potential market reversal points. A divergence occurs when the Awesome Oscillator’s direction differs from the price trend, providing a strong signal, especially when confirmed by a bounce off support or resistance levels. This approach not only highlights trading opportunities but also enhances trading decisions by utilizing the value of the Awesome Oscillator to gauge market momentum accurately.
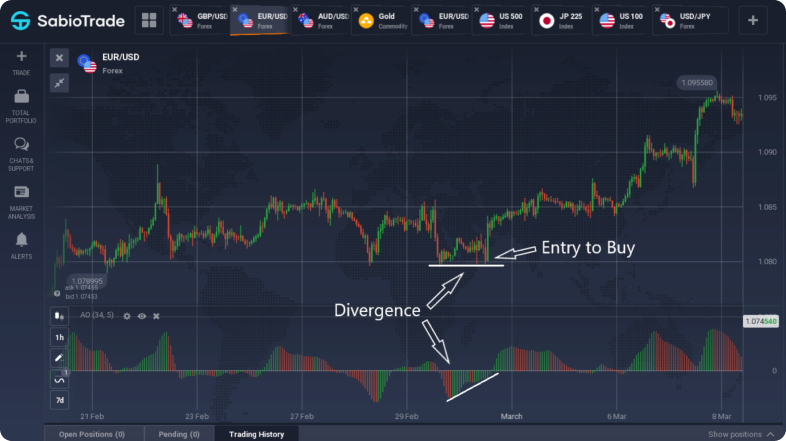
EUR/USD 1H Graph
The “Inverted Saucer” signal is a mirror image of the regular one.
“Zero Line Cross” Signal
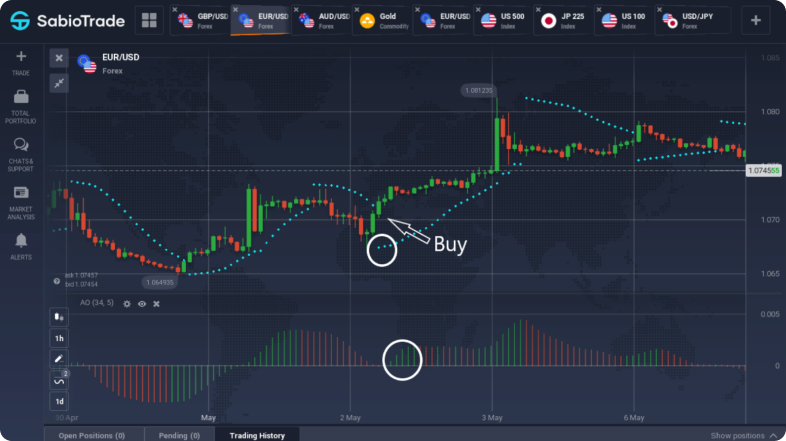
Crossing the zero line with the Awesome Oscillator can indicate either a buy or a sell opportunity, depending on the direction of the cross. When the Awesome Oscillator histogram crosses the zero line from below upwards, it suggests opening buy positions; conversely, a cross from above downwards signals to open sell positions.
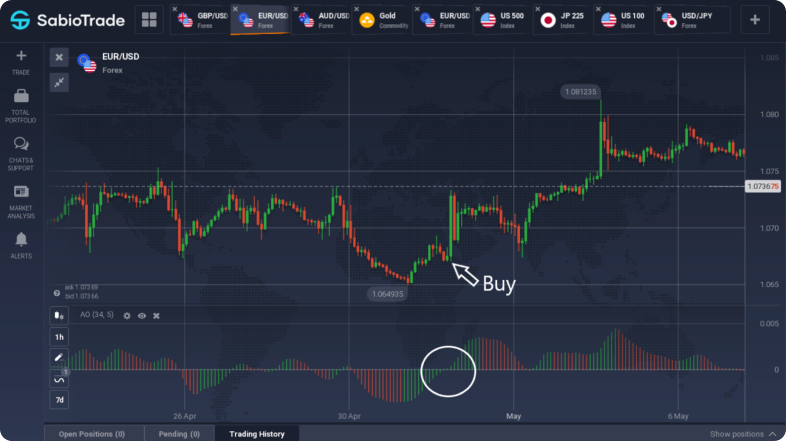
EUR/USD 1H Graph
This behavior of the Awesome Oscillator is akin to the simple crossing of two moving averages. However, among various Awesome Oscillator signals, the zero line cross is considered the least reliable and typically requires confirmation from additional filtering tools. Relying solely on this signal for opening trades can lead to a higher number of false entries compared to profitable ones. Thus, a positive mathematical expectation is often only achievable through the careful placement of stop losses and take profits, which helps manage the risks associated with the potentially misleading signals from a zero line cross.
Trading Strategy with Parabolic SAR
Like almost all technical analysis indicators, the AO is much more effective when used in conjunction with other tools. In the strategy discussed, besides the Awesome Oscillator, there is also the trend indicator Parabolic SAR. All tools are set on the chart with standard settings.
Buy trades in this strategy are opened under the following conditions:
- The Parabolic SAR moves downwards, placing markers below the chart.
- The AO is already above zero, with its last column colored green.
Sell trades are opened when the Parabolic SAR is positioned above the chart, the AO crosses the zero line from top to bottom, and the AC draws red columns.
Stop loss is set at the level of the Parabolic marker. Profits are taken when the Parabolic SAR changes sides, and markers begin to form above the chart.
This strategy performs best on hourly charts. It is better to use liquid currency pairs for trading.
Recommendations for Using the Awesome Oscillator
The effectiveness of any oscillator, including the Awesome Oscillator, hinges on the accuracy of its settings for specific assets, timeframes, and current market conditions. When exploring signals for binary options, it’s essential to choose an AO version that allows for adjustments in periods. Since Bill Williams, the creator of the Awesome Oscillator, first introduced his market indicators, the landscape, especially in the stock market, has seen significant changes. Unlike the Ichimoku Cloud, which is based on specific time cycles, the Awesome Oscillator requires empirical tuning of its parameters to align with current market dynamics.
Key points to remember:
- Two moving averages are utilized in the Awesome Oscillator: a “Slow” one with a 34-period setting that indicates the trend direction for the timeframe, and a “Fast” one with a 5-period setting that helps pinpoint entry opportunities.
- Avoid reducing periods for the trend component to steer clear of market noise. However, adjust the fast component based on the prevailing market volatility—opt for more periods in low volatility situations and fewer in high.
- The most dependable binary options signal with the Awesome Oscillator occurs when the price crosses the zero level, indicating strong trend movements.
- In inactive markets, while the AO might suggest a strong “saucer” formation, these are often just minor price movements that aren’t very profitable.
- The optimal trading periods are during the European and American sessions, which typically experience more significant price movements.
- Maintain trades on timeframes no lower than M30, as advised for binary options, with a preference for not trading below H1. The Awesome Oscillator can provide stable signals during extended flat market phases.
- Initiate trades only when the conditions of the flat span at least 30-50 points.
- Confirm Awesome Oscillator signals with channel indicators like Bollinger Bands for enhanced reliability. For example, consider trades from the midpoint when the bands rebound off their boundaries.
- Be mindful that prolonged sideways movements often precede sharp market breakthroughs; manage your risk accordingly.
- The “Alligator” indicator, another tool developed by Bill Williams, is best used in conjunction with the Awesome Oscillator to capture broader trend movements.
- Divergences should be verified with volume indicators to ensure that differing price movements reflect genuine market shifts, providing more reliable trading signals.
Wrap Up
The Awesome Oscillator, developed by Bill Williams, is a technical analysis tool that encapsulates a comprehensive approach to market dynamics. It is an indicator that enables traders to harness various awesome oscillator trading strategies effectively. The awesome oscillator formula, calculating the difference between a 5-period and a 34-period moving average, offers insights by presenting a histogram below the main trading chart.
Traders use the awesome oscillator to spot trading opportunities by observing whether the oscillator is above the zero line for potential buy signals or below it for sell signals. This method enhances the trading experience by enabling precise entry and exit points, which is crucial in managing risk and capitalizing on market movements. As mentioned in Exploring the Best Stock Trading Strategy for Sustainable Profits, using reliable entry/exit signals is key to achieving sustainable profits when trading stocks.
Bill Williams’ awesome oscillator strategy often includes looking for the ‘twin peaks’ pattern or utilizing the awesome oscillator as a divergence indicator, which can signal potential reversals. As described in The Secret of Trend Lines in Trading: A Comprehensive Guide for Traders, Awesome Oscillator divergences can be used in conjunction with trend lines to more accurately identify trend reversal points. Combining the awesome oscillator with other indicators, such as the MACD or the stochastic oscillator, is another popular awesome oscillator trading strategy. This combination helps validate the signals provided by the awesome oscillator, adding an extra layer of confirmation to the trading decisions.
To learn more about the awesome oscillator and how to use it effectively, traders should consider its role in the broader context of Bill Williams’ trading philosophies. By doing so, they can adapt the use awesome oscillator to their specific trading style and preferences, thereby optimizing their strategies for better outcomes in the financial markets.