Trend Line: What It Is, How to Use It in Trading
Trend lines, acting as the diagonal counterpart to parallel support and resistance levels, confine chart movements by reflecting the direction of price movements. Their slanted nature and ability to echo price directions make them pivotal in helping traders discern the current market trend, essentially serving as a visual representation of the market’s sentiment.
For those unfamiliar with our discussions on trends, it’s crucial to understand that a trend signifies the prevailing direction of price movement. It forms the basis for market participants’ strategies, guiding decisions on asset transactions. The direction of an asset’s price movement influences the choice of strategy, including whether to initiate long or short positions. The market recognizes three primary trends:
- Bullish – characterized by rising prices, encouraging traders to initiate long positions or “go long.” These positions are termed ‘long’ because they can be maintained for an extended period.
- Bearish – marked by declining prices, leading traders to open short positions or “go short.”
- Sideways or “flat” – observed when the price oscillates around a horizontal line within a narrow range, making it the most unpredictable trend due to the difficulty in forecasting future price movements.
Price volatility across various time frames can obscure the prevailing trend. Trend lines, by connecting points to draw a trend, offer a solution to this ambiguity. They not only facilitate the identification of a trend’s direction but also assess its strength and the likelihood of continuation or reversal. Drawing trend lines involves connecting two significant points – the lowest or highest over a given period, forming a line that serves as a visual guide to the trend’s trajectory.
In essence, trend lines are a fundamental tool in technical analysis, enabling traders to make informed decisions by providing insights into the long-term trend, validating trend lines, and identifying potential entry and exit points. Whether the trend reaches the trend line or breaks through it, these lines offer valuable signals for assessing the overall trend and making strategic trading decisions.
How to Draw a Trend Line
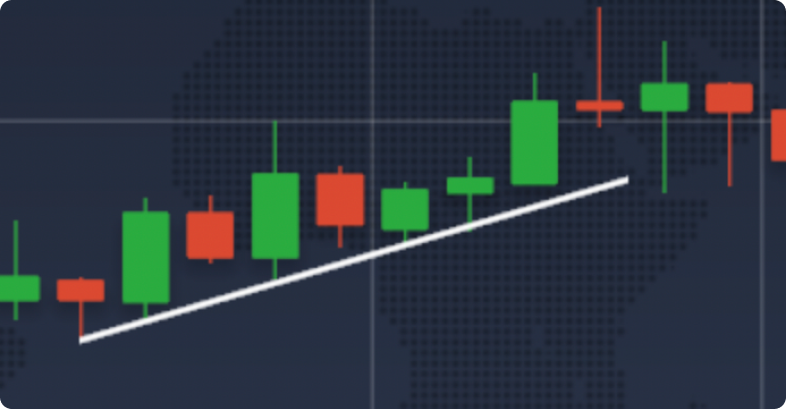
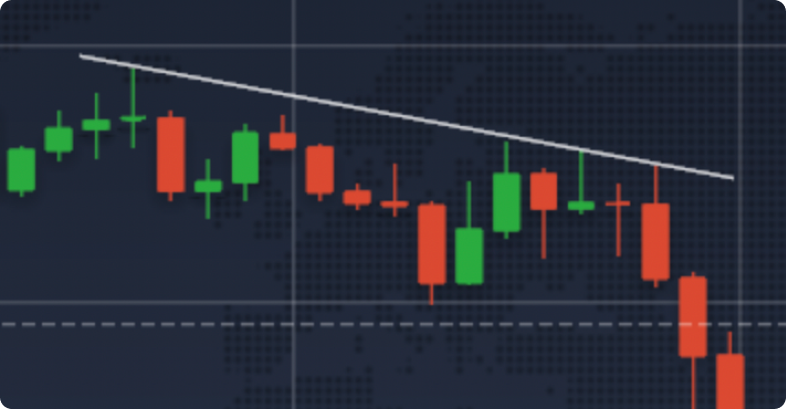
Drawing trend lines mirrors the process of marking support and resistance levels on a chart, utilizing price extremes – specifically, the lowest and highest points over a designated period. In the context of a bullish trend, the trend line, or upward trend line, is strategically positioned beneath the chart to connect lows, forming a line that indicates an ascending trajectory. Conversely, for a bearish trend, the trend line is placed above the chart, connecting highs and suggesting a descending price movement.
To construct a trend line in a bullish market scenario, one would follow these steps:
- Identify the lowest point on the chart, marking the initial point of the upward trend line.
- Search for the nearest low point relative to the initial one, ensuring it aligns with the upward trajectory.
- Draw a straight line, or diagonal line, to connect these points, effectively creating a visual representation of the trend.
- Upon a trend line break, select a new low as the subsequent anchor point, reinforcing the validity of the trend line and adjusting for the current trend.
This method, while straightforward, is instrumental in confirming the trend and establishing potential entry and exit points based on the slope of the trend line and its interaction with price movements.
For bearish trends, maximum points are used, but the overall method remains the same.
Trend lines are usually plotted on candlestick charts. There are two approaches to this – using shadows or bodies. In practice, there’s no significant difference between them, so either can be used. The key is to consistently stick to the chosen method.
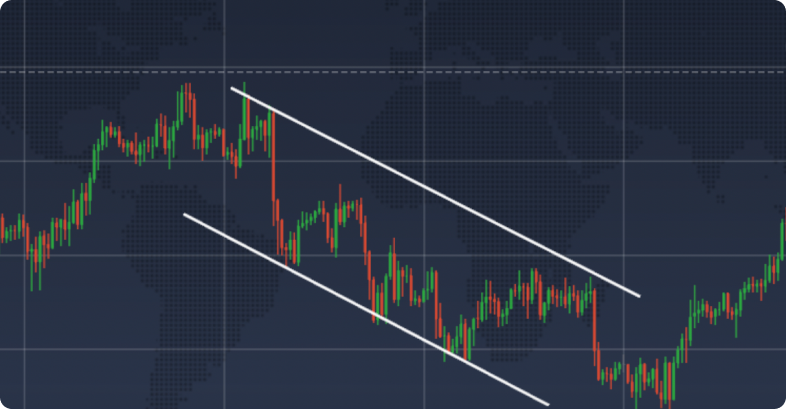
Trendlines and Channels: Understanding the Relationship
Trendlines and channels are pivotal tools in technical analysis, providing traders with insights into market trends and potential reversal points. Understanding the relationship between these tools can significantly enhance trading strategies, especially when it comes to identifying optimal entry and exit points.
Trading Strategies
Trading with trend lines involves a nuanced understanding of how they interact with market dynamics.
Firstly, the strength of a trend is often gauged by the number of extreme points a trend line intersects. The more points it crosses, the more entrenched the trend is considered to be, reducing the chances of a sudden shift in direction.
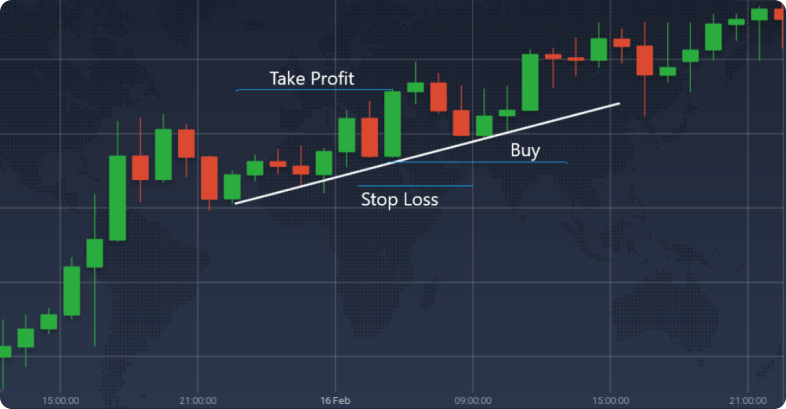
Secondly, trend lines serve dual purposes: they can either be utilized as independent indicators or be paired with support and resistance levels to enhance trading strategies. When used in tandem with support and resistance, the ideal moment to enter a trade is typically when the price action touches a trend line that aligns with these levels. Alternatively, a trend line breach might signal an opportune time to initiate a trade, based on the premise that such a breach could herald the beginning of a new trend direction. For instance, in a bullish scenario, if the market’s chart breaches a supporting trend line, suggesting a downward price movement, it might indicate a transition from a bullish to a bearish trend.
There are two primary strategies for trading with trend lines:
- Aggressive: This approach involves initiating a trade as soon as a candlestick breaks through the trend line, and closing the trade when the price action returns across the trend line. To mitigate risk, a stop-loss order is often placed just above the trend line. It’s important to note that trend changes are rarely abrupt. A first breach is often temporary, serving as a “test” of the minimum. Hence, seasoned traders might wait for a third breach before acting, to confirm the trend’s reversal.
- Conservative: This strategy entails entering a short position during the initial testing phase of the trend line and closing the position once the price action moves back across the trend line in the reverse direction. Although this approach might seem to offer more stability, it’s generally not advisable for novice traders due to its complexity and the subtleties involved in interpreting trend line tests and breaches.
In essence, trading with trend lines requires a blend of technical analysis, patience, and strategic planning to navigate the markets effectively.
Summary
Trend lines serve as a fundamental and straightforward instrument in technical analysis, offering guidance through intricate market scenarios and signaling opportune times for initiating or concluding trades. Their ability to connect significant price points and outline the market’s directional momentum makes them invaluable for traders seeking to make informed decisions. By understanding the dynamics of trend lines, including their formation, breaches, and the significance of their slopes, traders can better anticipate market movements and strategize accordingly. This utility underscores the importance of mastering trend line analysis as a means to enhance trading efficacy and profitability in the stock market.