Chart Analysis: A Guide for Beginners on Reading Forex Charts for Trading


The Forex market is the largest and most liquid financial market on the planet. It operates 24 hours a day, five days a week, and involves trading between a wide range of different types of buyers and sellers around the world. In this dynamic market, understandong Forex charts is extremely important to start trading. These charts express the exchange rates between currencies and provide traders a lot of information about trading volume and price change. Mastering the art of reading these charts is a fundamental skill for successful trading, which allows you to make decisions based on historical and current performance of different pairs of currencies.
If you wisht to learn how to read Forex charts, you must understand that they are made of several core components and there are a lot of different terminologies that traders must master before going to a trading platform and start trading with their own money. The price axes on a forex pair chart represent the exchange rates of the currencies being traded. The vertical axis typically shows the price, while the horizontal axis displays the selected timeframe. Timeframes can range from minutes to hours, days, or even months, depending on the trader’s strategy and investment horizon.
Another important aspect of Forex charts is the use of colors. Typically, green and red are used to represent bullish—rising prices—and bearish—falling prices—market conditions. A green candlestick on a forex chart shows that the closing price was higher than the opening price for the given period, signaling buying pressure. A red candlestick shows that the closing price was lower than the opening price, indicating selling pressure. Let’s further explore the different types of charts you can use to enhance your trading activity and find out what is the best way to read what they convey.
Many forex traders use chart reading to open a trading position to profit from future price movements. These charts are usually a visual representation of currency price movements over a specific period and come in various forms, each with its unique features and uses. Some traders may use line charts, whereas others may feel more confident using candlestick charts or point and figure charts.
Regardless of choice, it is crucial to know that there are many different types of charts. And it is a good idea to explore all of them to identify which better suits your forex trading strategy.
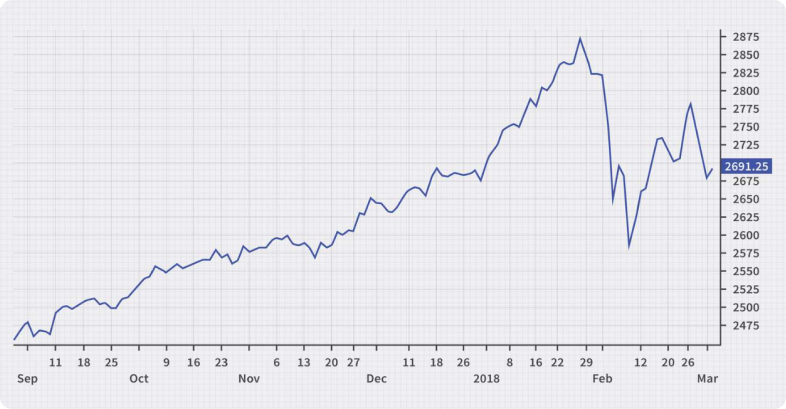
A line chart is the simplest type of Forex chart and it illustrates the direction of the currency pair’s price over a given period. The chart is formed by connecting a series of data points with a line. This type of chart will show a clear and straightforward view of the general price movement over time, making it easier for traders to identify overall trends.
However, line charts lack detailed information. They do not show the open, high, low, and close prices for each period, only the closing price is plotted. Therefore, while line charts are great for a quick overview of the price history, they might not provide enough detail for more in-depth analysis.

A bar chart, also known as an OHLC—Open, High, Low, Close—chart, provides more detail than a line chart. Each bar represents a specific trading period – the open and close prices are represented by horizontal lines on the vertical line, while the high and low prices are the upper and lower ends of the bar. This gives traders a more comprehensive view of market activity during each period.
Bar charts may be a bit complex to understand, especially for beginners. They also do not visually represent price patterns as clearly as candlestick charts, making trend analysis and prediction more challenging, not being suitable for every trading style out there.
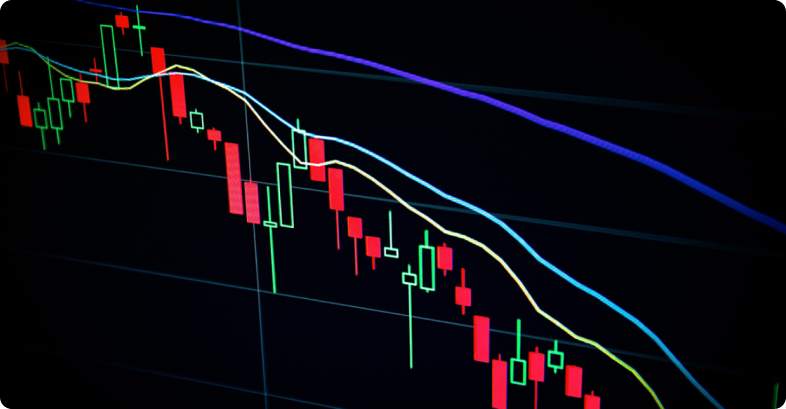
Candlestick charts are one of the most popular types of Forex charts among forex traders due to the wide range of information they display. Similar to bar charts, a candlestick chart shows the open, high, low, and close prices for each period. However, the large ‘body’ of the candlestick represents the range between the open and close prices, and the ‘wick’ shows the range between the highest and lowest prices.
Candlestick charts are highly visual, and facilitate the identification of price patterns and market trends. They also provide more detailed information than line charts and are generally easier to read than bar charts.
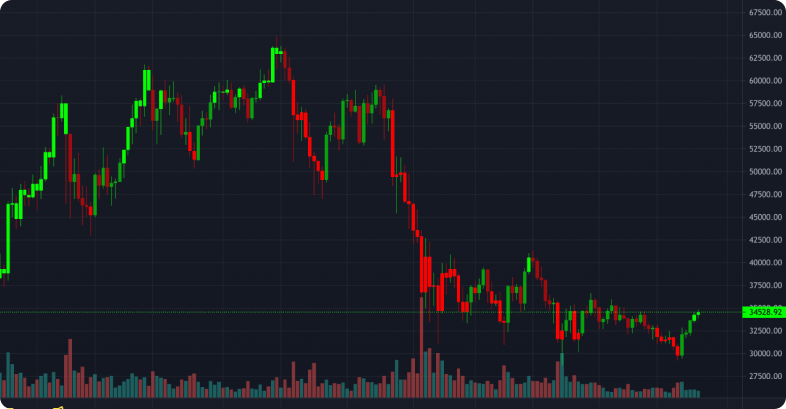
Candlestick charts are one of the favorites forex chart types due to how easy they make it to read market data. These charts are used for several financial instruments, not only Forex, but also Stocks and Cryptocurrencies.
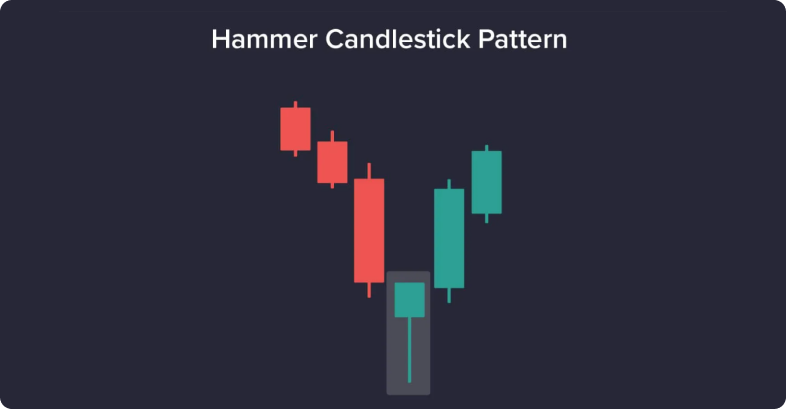
Candlestick charts are known for their unique patterns that can signal potential market movements. Single candlestick patterns such as the Hammer, Hanging Man, and Abandoned Baby can tell us a lot about market sentiment. For instance, a Hammer at the end of a downtrend or a Hanging Man at the end of an uptrend can be indicators of a possible trend reversal. These patterns are formed based on the relationship between the opening, closing, high, and low prices represented by the body and wicks of the candlesticks.
Patterns involving multiple candlesticks, like the Head and Shoulders, Triangles, and Flags, offer a different perspective. These patterns often indicate a continuation or reversal of the current trend over a longer period. Unlike single candlestick patterns like Hammers, these patterns take into account the broader market context and involve a series of candlesticks to form a recognizable shape.
Even though traders use these patterns to extract valuable market insights, there are other factors to consider before entering a trade. The volume of trades, for instance, is usually used to confirm the strength of a pattern. A high volume during the formation of a pattern or breakout of a trading range often indicates strong interest and can signal a more significant price movement. Other technical indicators such as moving averages, Relative Strength Index, and Bollinger Bands can also provide further information about price action and help you evaluate opening a position.
Technical indicators are statistical calculations based on a currency pair’s price and volume. Forex traders use these indicators often to have a glimpse into the probablility of future price movements and identify trading opportunities. These indicators are typically plotted on charts used by technical analysts and can display patterns that can be interpreted as buy or sell signals. They are built using different formulas that incorporate historical price and volume data, and each indicator provides a unique measure of market conditions.
One of the best forex indicators is the Moving Average. It smooths out price data by creating a constantly updated average price, which can be taken over different periods of time, like 10 days, 50 days, or 200 days. The SMA—Simple Moving Average—can help traders identify the overall direction of the trend and provide opportunities for buying or selling. For instance, when the price crosses above the moving average, it may generate a buy signal, and when it crosses below, it may generate a sell signal. You may also evaluate the moving averages crossing each other to consider entering a trade.
Oscillators are another type of technical indicator commonly used in a trading day. They are typically used when a chart isn’t showing a clear trend in either direction. Two common oscillators are the Relative Strength Index and the Moving Average Convergence Divergence. The RSI compares the magnitude of recent gains to recent losses in an attempt to determine the overbought and oversold conditions of a Forex pair, whereas the MACD is a trend-following momentum indicator that shows the relationship between two moving averages of the price. These indicators may help you identify potential points where the market may turn around.
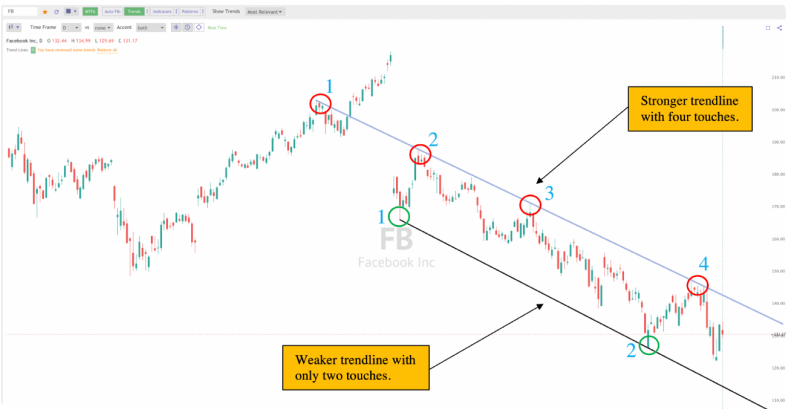
In Forex trading, a trend is the general direction that the market is moving in over a specific period of time. An uptrend, or bullish trend, is characterized by a series of higher highs and higher lows. This means that the price is generally increasing over time. Traders often look to enter ‘long’ positions in an uptrend, buying a currency pair with the expectation that the price will continue to rise.
On the other hand, a downtrend, also known as bearish trend, is indicated by a series of lower highs and lower lows. This means that the price is generally decreasing over time. In a downtrend, traders may look to enter ‘short’ positions, selling a currency pair with the expectation that the price will continue to fall.
A sideways trend, also known as a horizontal trend or a trading range, occurs when the price moves sideways between a high and a low level. This type of trend indicates that the forces of supply and demand are evenly balanced, and there is no clear direction for the market. Trading in a sideways market can be different from trading in uptrends or downtrends. Traders often use oscillator indicators to look for a buying opportunity at the lower level of the range and a selling opportunity at the upper level, rather than following a clear upward or downward trend.
Recognizing trend reversals is a key skill when you read a Forex chart. Reversals occur when the direction of the trend changes and can be identified by changes in the pattern of highs and lows. In an uptrend, a reversal might be indicated by the price making a lower high and a lower low. In a downtrend, a reversal might be signaled by the price making a higher high and a higher low. However, it’s important to note that price movements can be extremely volatile and trend reversals should be confirmed with other indicators, such as volume or oscillators, to avoid false signals. There is also a very famous quote in financial market that says that “the trend is your friend until it ends”.
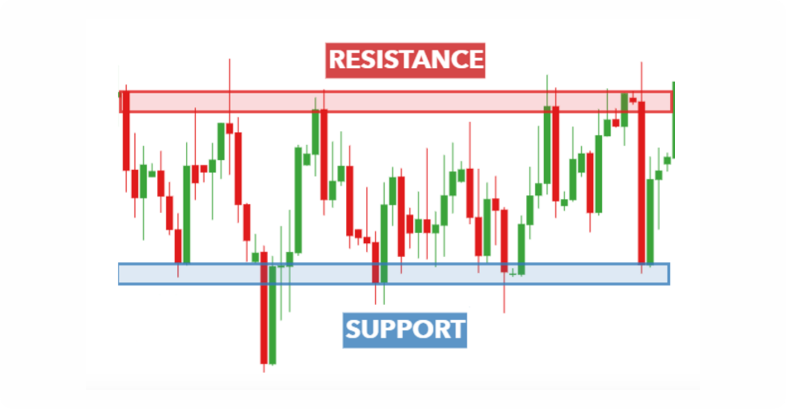
Support and resistance levels are core concepts to understand. A support level is a price level where the price tends to find support as it falls. This means the price is more likely to “bounce” off this level rather than break through it. On the other hand, a resistance level is a price level where the price tends to find opposition as it rises. The price is likely to turn around at this level rather than break through it.
Identifying these levels on a chart can be a profitable skill. Traders often use historical price data to mark support and resistance levels on charts, looking for areas where the price has reversed direction in the past. These levels are not exact numbers but are seen more like a zone that can range from a few dollars high to a few dollars low. The more often the price tests a level of resistance or support without breaking it, the stronger that resistance or support level is.
When it comes to trading decisions, support and resistance levels play a relevant role. You can use these levels to identify potential opportunities for buying or selling. If a price drops towards a support level, for instance, you might consider buying, believing that the price will bounce back up. Of course, if the price rises towards a resistance level, you might consider selling with the expectation that the price will reverse and start to fall down. However, a breakthrough a support or resistance level can also signal a potential trend reversal, which could be a sign to enter a trade in the direction of the break. Once more, volume plays a key role in these cases, either to confirm or deny a breakthrough.
Chart analysis is a fundamental part of a successful trading strategy in live Forex. It is the art of studying price movements and patterns on charts to measure the likelihood of future market behavior. Professional traders use a diverse range of charts, such as line charts, bar charts, tick charts, and candlestick charts, and they apply different technical indicators like moving averages, RSI, and MACD to identify trends, support and resistance levels, and reversal points. These insights help them decide when to enter or exit trades, set stop losses and targets, and manage risk.
While chart analysis can provide high-quality insights, it is important to remember that it is just one piece of the puzzle. Combining chart analysis with other forms of analysis, such as fundamental and sentiment analysis, can provide a broader view of the market. Fundamental analysis involves evaluating economic factors like interest rates, employment data, and political events, while sentiment analysis involves gauging market sentiment through news reports, social media, and other sources. By integrating these different forms of analysis, professional traders make more confident decisions and increase their chances of success.
Once traders have gained insights from their analysis, the next step is to act on them. This could involve entering a trade based on a trend identified on a chart, adjusting a trading position in response to a change in market sentiment, or exiting a trade when a technical indicator signals a trend reversal. It is important for traders to have a clear trading plan and to stick to it, rather than making impulsive decisions based on short-term price action.
In Forex trading, it is crucial to manage risk effectively. One way to do this is by setting stop losses and targets. A stop loss is a predetermined level at which a trader will close a losing trade to prevent further losses, while a target is a level at which a trader will close a winning trade to lock in profits. These levels should be set based on the trader’s risk tolerance and the overall volatility.
Another key aspect of risk management is avoiding traps. These are situations where a seemingly profitable trading opportunity turns out to be a false signal. For example, a sudden support or resistance levels breakout might seem like a good time to enter a trade, but it could be a ‘false breakout’ that quickly reverses if there is no trading volume. You can avoid these traps by using technical indicators to confirm trading signals and maintaining a disciplined approach to trading.
We’ve explored several topics to help you understand and read Forex charts effectively. We started by understanding what a Forex chart is and how to read it. We then explored the different types of Forex charts—line, bar, and candlestick charts—and how each can be used to track and predict market movements. We went deeper into candlestick charts, more specifically, and learned about several patterns that can signal potential trading opportunities. We also discussed the role of technical indicators in Forex trading and how they can be used in conjunction with chart analysis to make beter decisions and avoid traps.
We further delved into the concept of trends and how to identify them using technical analysis. We learned about support and resistance levels, which are key to understanding market movements and making good decisions. Finally, we discussed how to integrate all these elements to trade Forex like a professional.
Becoming proficient at reading and interpreting Forex charts takes time and a lot of practice. Keep learning, stay curious, and don’t be afraid to apply what you’ve learned in your trading journey!