Understanding the Wyckoff Schematics
The Wyckoff Method is a technical analysis approach developed by Richard Wyckoff, one of the most influential traders and investors of the early 20th century. Wyckoff’s methodology is based on the idea that prices move in a series of waves, driven by the interactions between supply and demand. By understanding these market movements and the forces that shape them, you can leverage fluctuations in the market to obtain valuable insights into market structure and make more profitable investment decisions.
Who was Richard Wyckoff?
Richard Demille Wyckoff was an American stock market investor, founder of the Magazine of Wall Street, and a key character in technical analysis during the 20th century. Born in 1873, Wyckoff began his career as a stockbroker and quickly became fascinated with the behavior of markets and the psychology of traders. Through his observations and research, Wyckoff created a unique approach to analyzing market trends, the Wyckoff theory, used to help traders identify profitable trading decisions across accumulation and distribution schematics.
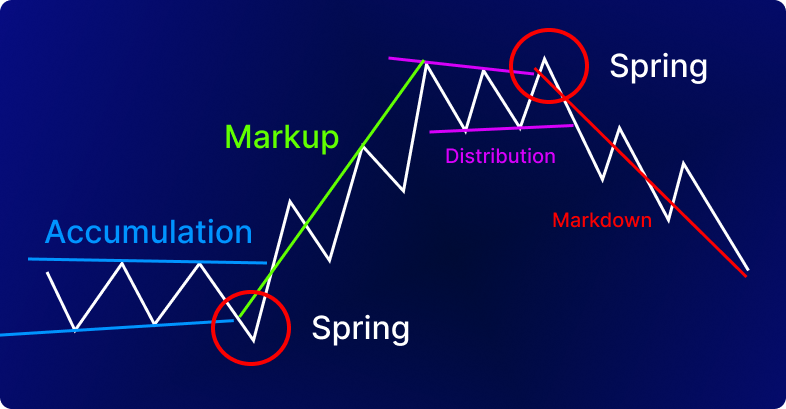
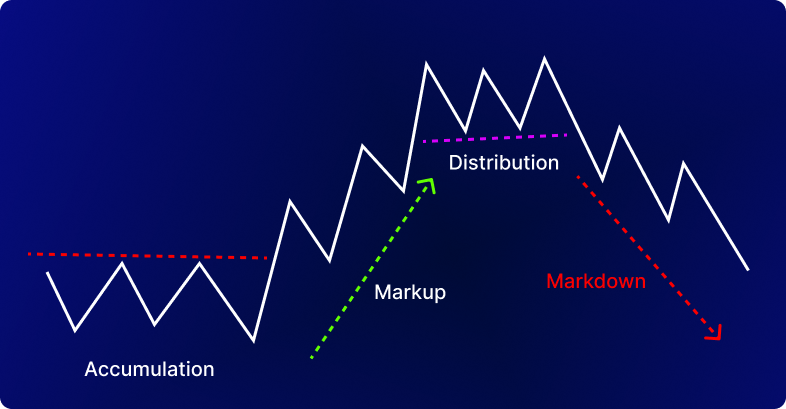
The Wyckoff Method is a trading approach that focuses on understanding market movements and identifying key phases of market cycles. At the center of this method lies the concept of the accumulation and distribution schematics, which provides a visual representation of market participants’ behavior and helps you identify areas of support and resistance.
The Three Laws of Wyckoff Explained
The Wyckoff Method is built around three core laws that govern market behavior:
-
The Law of Supply and Demand: Prices will only move up or down based on the balance between supply and demand.
-
The Law of Cause and Effect: Every market action has a cause and an effect, with the cause being the imbalance between supply and demand. This imbalance may be caused by market speculation, news, or fundamental developments.
-
The Law of Effort vs. Result: The effort—or volume—behind a price move is proportional to the resulting price change and both effort and result can be used to identify the stage of the trend (e.g., accumulation, distribution, markup, or markdown).
These three Wyckoff laws are the heart behind the Wyckoff Trading Method and are a key component of any market analysis based on Wyckoff’s approach to trading.
How the Wyckoff Method differs from other trading strategies
The Wyckoff Method stands out from other trading strategies in its focus on understanding market dynamics and the development of events and phases in trading. Unlike other approaches that rely on indicators or formulas, the Wyckoff Method emphasizes the importance of context and nuance to avoid being on the wrong side of the market. By studying the interactions between supply and demand, traders using the Wyckoff Method can gain a much higher understanding of market psychology and leverage this understanding to make more profitable decisions. The Wyckoff method of trading is particularly useful for those who value a more holistic approach to market analysis.
Going Deeper Into the Wyckoff Trading Method
In the Wyckoff Method, understanding accumulation and distribution is crucial for navigating different market cycles. According to Richard Wyckoff, markets move in a series of phases, with accumulation and distribution being the key drivers of price action.
Accumulation occurs when institutional investors and savvy traders buy up shares, creating a foundation for future price increases (markup). On the other hand, distribution occurs when these market participants sell their shares, leading to price declines (markdown).
The Wyckoff Market Cycle: A Five-Step Approach to the Market
The core idea behind the Wyckoff analysis is that the market moves in different cycles and phases. Let’s explore a bit further the accumulation and distribution schematics to improve our understanding of these phases approached by the Wyckoff method.
Interpreting the Accumulation Schematic According to Wyckoff
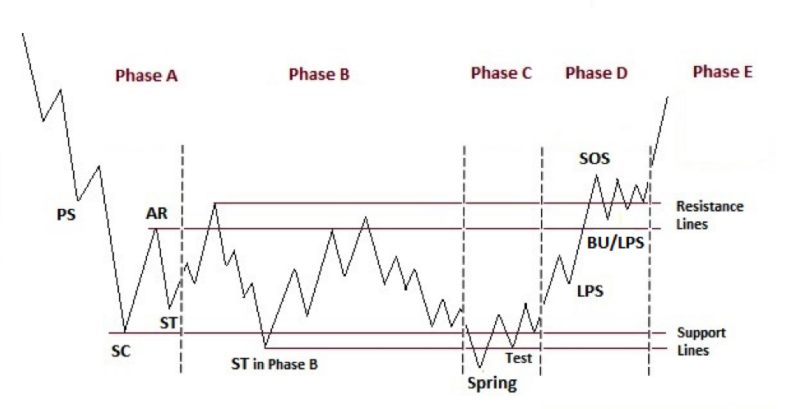
The accumulation schematic is a visual representation of the accumulation phase, characterized by a trading range with decreasing price action but increasing trading volume.
According to Wyckoff, the accumulation schematic is divided into five sub-phases:
Phase A is characterized by a slowing down movement of the prior downtrend. This can also be seen as the selling climax and the point at which the dominance of supply may weaken. Prices may start to consolidate within a horizontal trading range.
Phase B in accumulation can be described as the building of a cause for a new uptrend. In this phase, institutional investors and savvy traders start to accumulate shares, laying the foundation for future price increases. An increase in trading volume can also be identified during this phase.
Phase C marks a decisive point in the phase of accumulation. This is where the smart money ascertains that stock prices are ready for a markup. It is in this phase that the stock price goes through a decisive test of the remaining supply, a specific price movement, which appears to signal a continuation of the downtrend, actually marks the beginning of a new uptrend, trapping late sellers. In this method, a successful test of supply provides a high-probability trading opportunity. A low-volume test indicates that the stock is likely to move up, making it a good time to initiate a long position.
Phase D should display a consistent dominance of demand over supply if the analysis is correct. This is evident in a pattern of price advances on increasing volume and wider price ranges, as well as price declines on decreasing volume and narrower price ranges. During this phase, the price will move at least to the previous high point. The price declines during this phase are excellent opportunities to initiate or add to profitable long positions.
Phase E is the breakout of the accumulation trading range. The demand is now the dominant force and the bullish trend becomes clear to the overall market. Any setbacks, such as brief price drops or reactions, are typically short-lived. The stock may enter a new, higher trading range at any point in this phase, where large investors may sell some shares or buy additional shares. These new trading ranges can be stepping stones to even higher price levels.
Understanding the Distribution Schematic and Its Impact on Trading
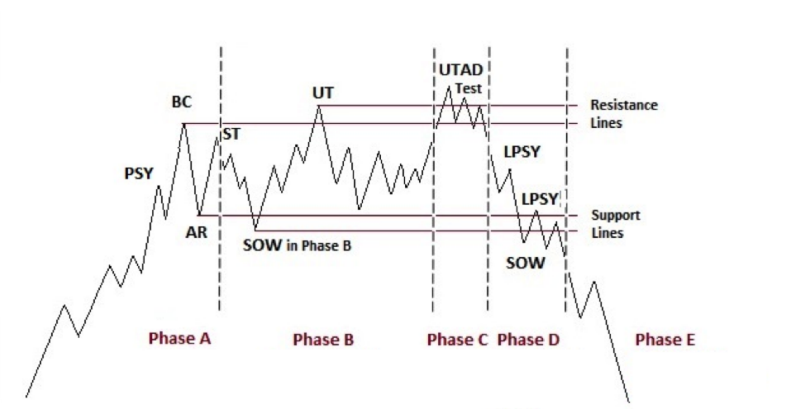
The distribution schematic, on the other hand, represents the phase marked by a distribution trading range with increasing price action and decreasing trading volume. This phase is also described by the five-step approach to the market:
Phase A marks the end of the previous upward trend and the start of a distribution phase. Up to this point, demand has been driving the market and making prices reach higher values, but the first signs of supply entering the market become apparent. This is marked by an initial surge of supply and a buying climax, usually followed by a natural price drop and a test of the buying climax at a lower level, with decreasing trading activity. However, the upward trend may also lose steam without dramatic events, showing signs of exhaustion with decreasing price movement and trading activity.
Phase B in distribution lays the groundwork for a new downward trend. During this time, large investors and professionals are selling their shares and taking short positions in anticipation of a price drop. This phase is similar to the corresponding phase in an upward trend, but with the key difference that large investors are now selling shares and trying to reduce demand. This process shows that the balance between supply and demand has shifted in favor of supply. For example, price drops are often accompanied by increased volume and a broad trading range emerges.
Phase C becomes apparent through a specific price movement that tests the remaining demand. This price movement occurs when the price moves above the resistance level of the distribution trading range, only to quickly reverse and close within the range. This movement is a test of the remaining demand and can also be seen as a trap for uninformed traders who think the uptrend is resuming. In reality, it’s a tactic used by smart money to mislead the public on the future trend direction and sell additional shares at higher prices before the price drops. This movement can also induce retail traders who are short to cover their positions and surrender their shares to the larger interests.
Aggressive traders may initiate short positions after this price movement, as the risk-reward ratio is extremely favorable. In some cases, demand may be so weak that the price doesn’t reach the level of the initial surge of supply or the first test of that supply. In such cases, Phase C’s test of demand may be represented by a smaller price movement within the distribution range.
Phase D begins after the tests in Phase C reveal the final attempts of demand. During this phase, the price moves down to or below the support level of the distribution trading range. The signs that supply is now in control become clearer, either with a clear break of support or a decline below the mid-point of the trading range after a price movement. There are often multiple weak rallies during this phase, which provide excellent opportunities to initiate or add to profitable short positions. Anyone still holding a long position during this phase is taking a significant risk.
Phase E shows the development of a downward trend. The stock finally leaves the distribution
range and supply takes over. Once the support level is broken, this breakdown is often tested with a rally that fails at or near the support level. This represents a great opportunity to sell short. Any subsequent rallies during the price drop are usually weak. Traders who have taken short positions can adjust their stop-loss levels as the price falls. After a significant decline, intense trading activity may signal the start of a new phase of either re-distribution or the start of an accumulation schematic.
Wyckoff’s Insights into Market Trends and Trading
According to Wyckoff, understanding accumulation and distribution is essential for identifying market trends and making informed decisions. By analyzing the development of the Wyckoff events and phases, traders can identify key areas of support and resistance and anticipate potential price movements. Wyckoff’s law states that prices move in the direction of the greatest ease, meaning that traders should seek to identify the force of accumulation or distribution to enter a winning position towards the direction of the trend.
Maximizing Gains with the Wyckoff Theory
Applying the Wyckoff Method of trading and investing is a smart approach to navigating the markets. The schemas presented by Wyckoff’s approach provide an excellent structure for understanding market dynamics and placing well-informed trading positions. To enter the market effectively, you can use Wyckoff’s price cycle and periods of accumulation and distribution to identify opportunities with a high probability of profits.
Wyckoff’s Laws of Supply and Demand offer an extremely powerful tool for maximizing gains. By understanding the dynamics behind supply and demand and the law that states that prices move in the direction of the greatest ease, you can obtain a much clearer indication of where markets are going price-wise.
Wyckoff’s accumulation and distribution schematics are essential components of his method. These schematics are useful for providing a visual representation of market dynamics, making it easier to understand and identify support and resistance levels according to the dynamics between supply and demand. This allows you to position more informed bets towards bullish or bearish price action.
Several market makers and other experienced traders use Wyckoff’s cycle to navigate market dynamics. The “smart money”, for instance, uses Wyckoff’s phases and events to identify and place traps in key areas of accumulation and distribution trading ranges and to anticipate price movements. This knowledge is a great advantage in swing trading and day trading.
To outperform the market, traders must be aware of the signs of strength and weakness in price action. According to Wyckoff, a key sign of strength is the trading volume.
By using Wyckoff’s Laws of Supply and Demand, understanding accumulation and distribution schematics, and understanding the role of trading volume in the Wyckoff accumulation and distribution schematics, traders can place high probability positions and outperform the overall market.
Using Volume to Confirm Phases in the Accumulation Schematic and Distribution Schematic
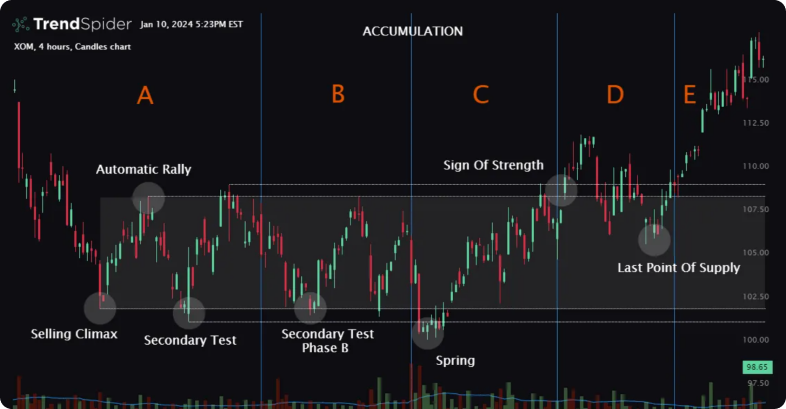
Trading volume confirms Wyckoff phases and helps you identify areas of support and resistance. Volume validates accumulation and distribution phases, enabling well-informed decisions.


