Ways to Best Apply the Trendline Strategy


In the trading universe, whether it’s stocks or commodities you’re after, following the trend is key, particularly when you’re leveraging trend lines. This strategy is straightforward and widely understood among traders. It’s a proven method that has stood the test of time, remaining effective today and promising for the future. Why? Because capitalizing on profits with minimal effort is best achieved by harnessing the power of trend continuation.
Curious about drawing trend lines and utilizing them effectively in your trading strategies? Stay tuned for insightful tips in this article, where we delve into trend line trading, illustrating how these powerful tools can enhance your trade setups. From identifying the direction of the trend to utilizing trendline bounce and breakout strategies, we cover the essentials of making trend lines a pivotal part of your trading arsenal. Whether you’re a day trader looking to capture quick moves or a swing trader aiming for larger swings, understanding how to classify and draw trendlines accurately is crucial. This piece will also touch on the significance of candlestick patterns and entry triggers in confirming trendline strategies, ensuring high probability setups for your trades.
Navigating the strategy behind trend lines can seem both straightforward and somewhat intricate. Identifying the trend’s direction is your first step—sketch a line across the lows for an uptrend or the highs for a downtrend. Essentially, a line drawn at support levels acts as your trend line in an uptrend, while a line at resistance levels serves this purpose in a downtrend. This process is fundamental in trendline trading.
However, the complexity arises when a novice trader struggles to accurately classify the trend, possibly drawing an incorrect trend line. Such a misstep could trigger a misinformed trade decision, increasing the risk of a financial setback. This scenario underscores the importance of not only mastering the art of drawing trendlines but also the need for a solid understanding of trend continuation and reversal indicators. It highlights why trading tools and strategies, such as price action trading and the use of candlestick patterns for entry triggers, are crucial for confirming the validity of trend lines and enhancing the probability of successful trades.
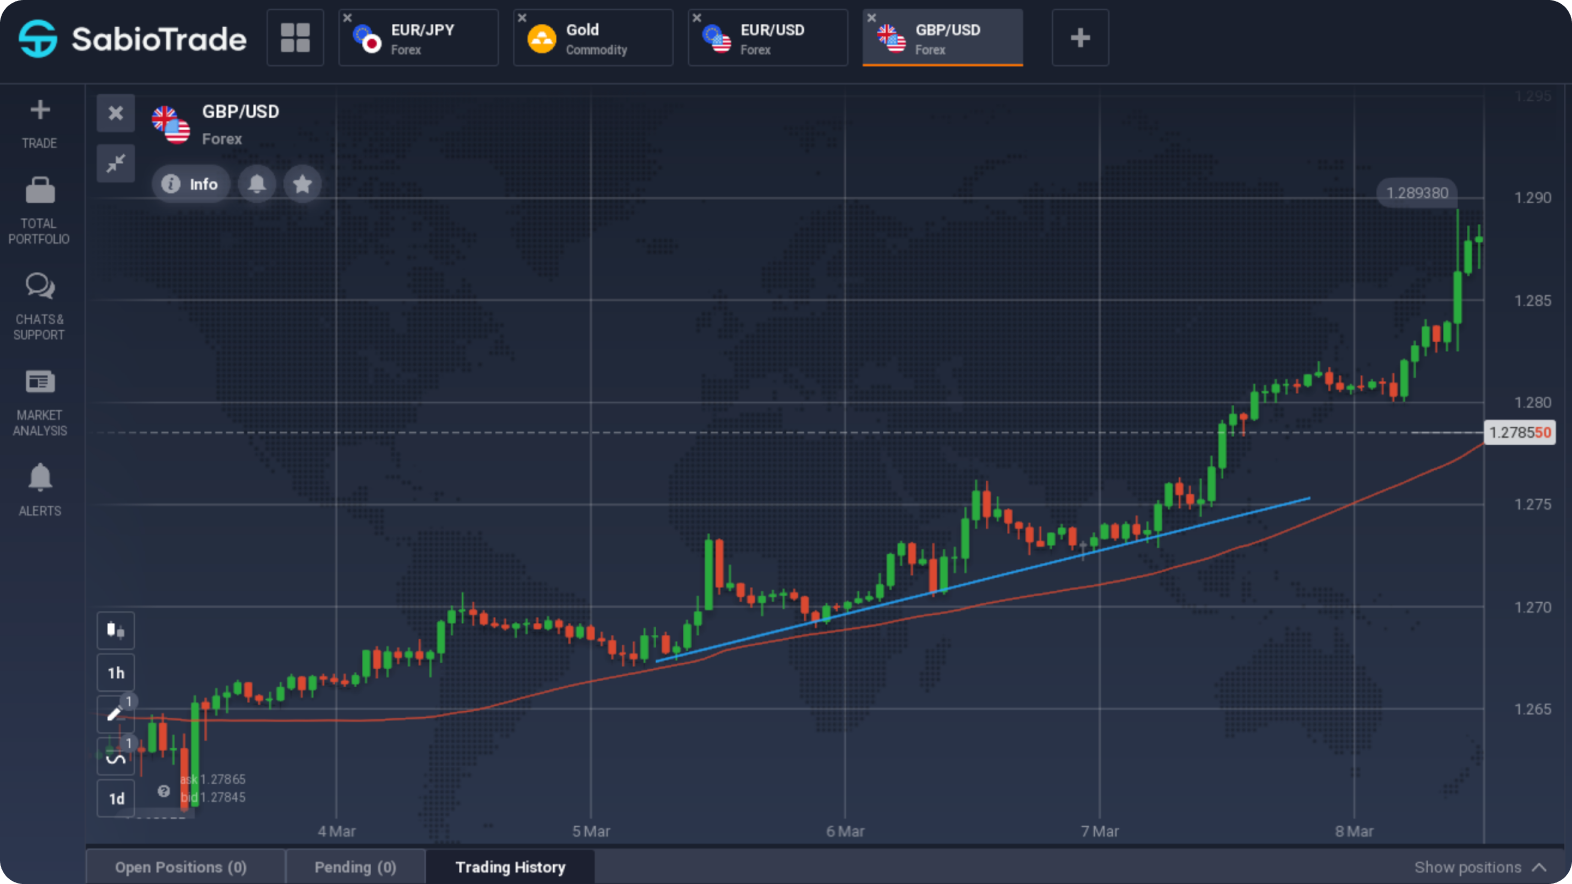
On the GBP/USD chart, we observe a clearly defined upward trend. A support line has been drawn in blue, distinctly indicating the trend’s direction as an ascending support line.
There’s a rule stating that for a trend line to be considered valid, it must intersect at least three low or high points, specifically at levels of support or resistance.
Therefore, in the example above, we have a valid trend line, confirmed by multiple touches of the price chart.
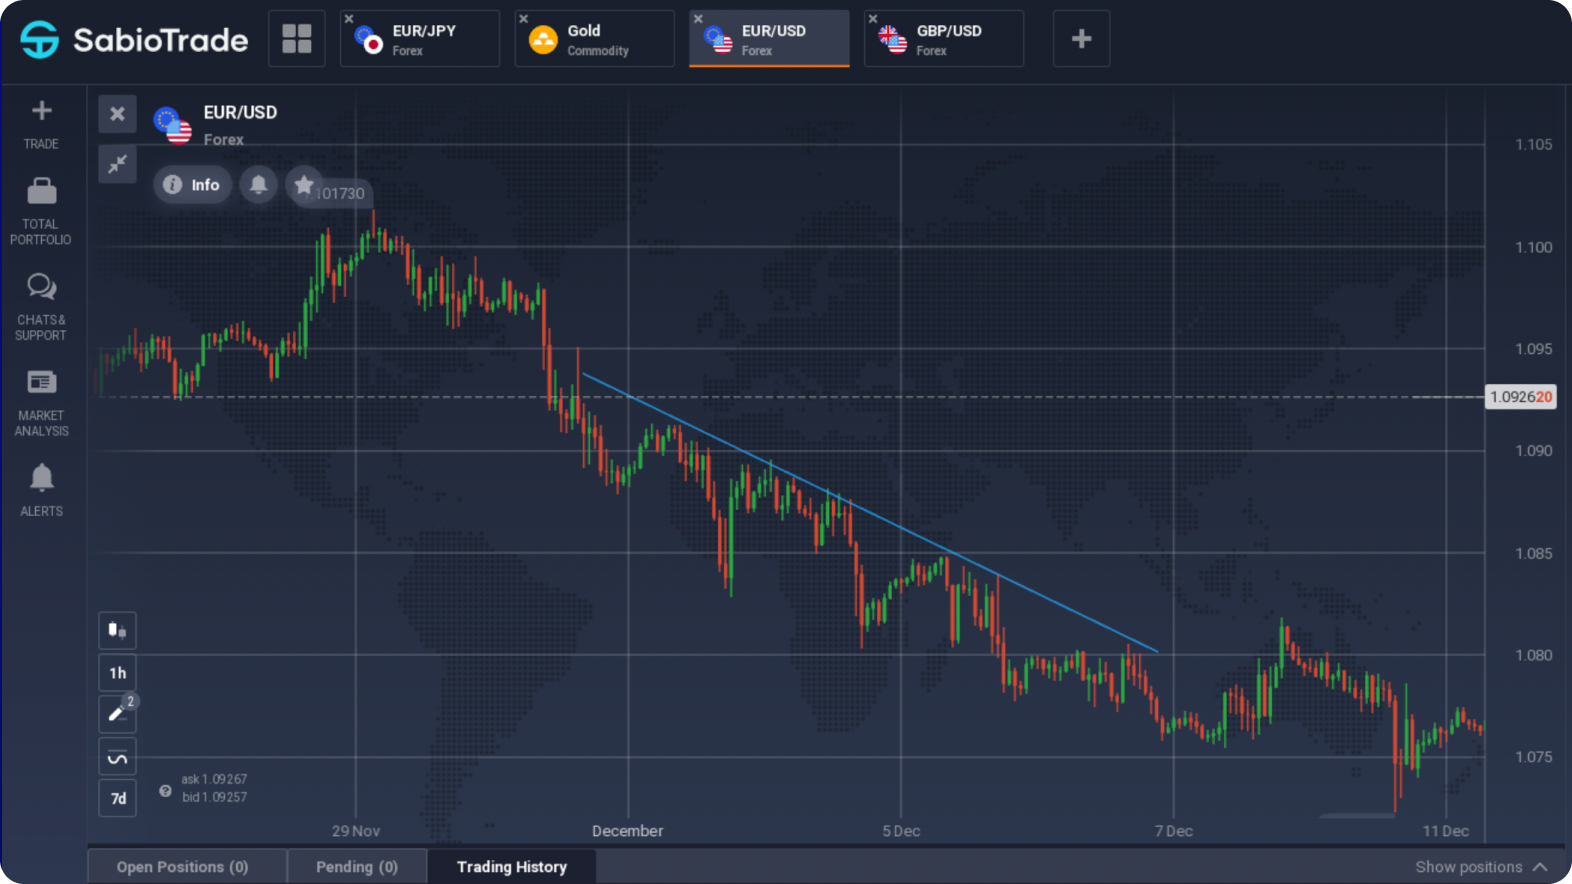
In the example above, a downward trend is depicted in the EUR/USD pair. Here, the trend line is drawn along the peak points, namely the resistance levels, clearly indicating the direction of the current trend. After three touches on the retracements by the price chart of the upper points, the trend line could already be considered confirmed, allowing traders to plan a trade to sell the asset.
It’s important to note, as professional traders well understand, that the price chart does not always precisely touch the support or resistance lines during retracements. As the trend develops, bears or bulls will continuously attempt to take control of the situation, and their attempts may vary in intensity. Therefore, the price may either not reach the trend line or break through it falsely.
Thus, novice traders should not wait for exact touches of the trend line exclusively; otherwise, instead of becoming traders, they might end up as “waiters,” which is unlikely to bring them any profit.
Example of a “Local” View of the Situation
The chart shows a clearly defined downward trend, and the validity of the trend line, drawn through the high points on the GBPUSD chart retracements, is confirmed by several touches.
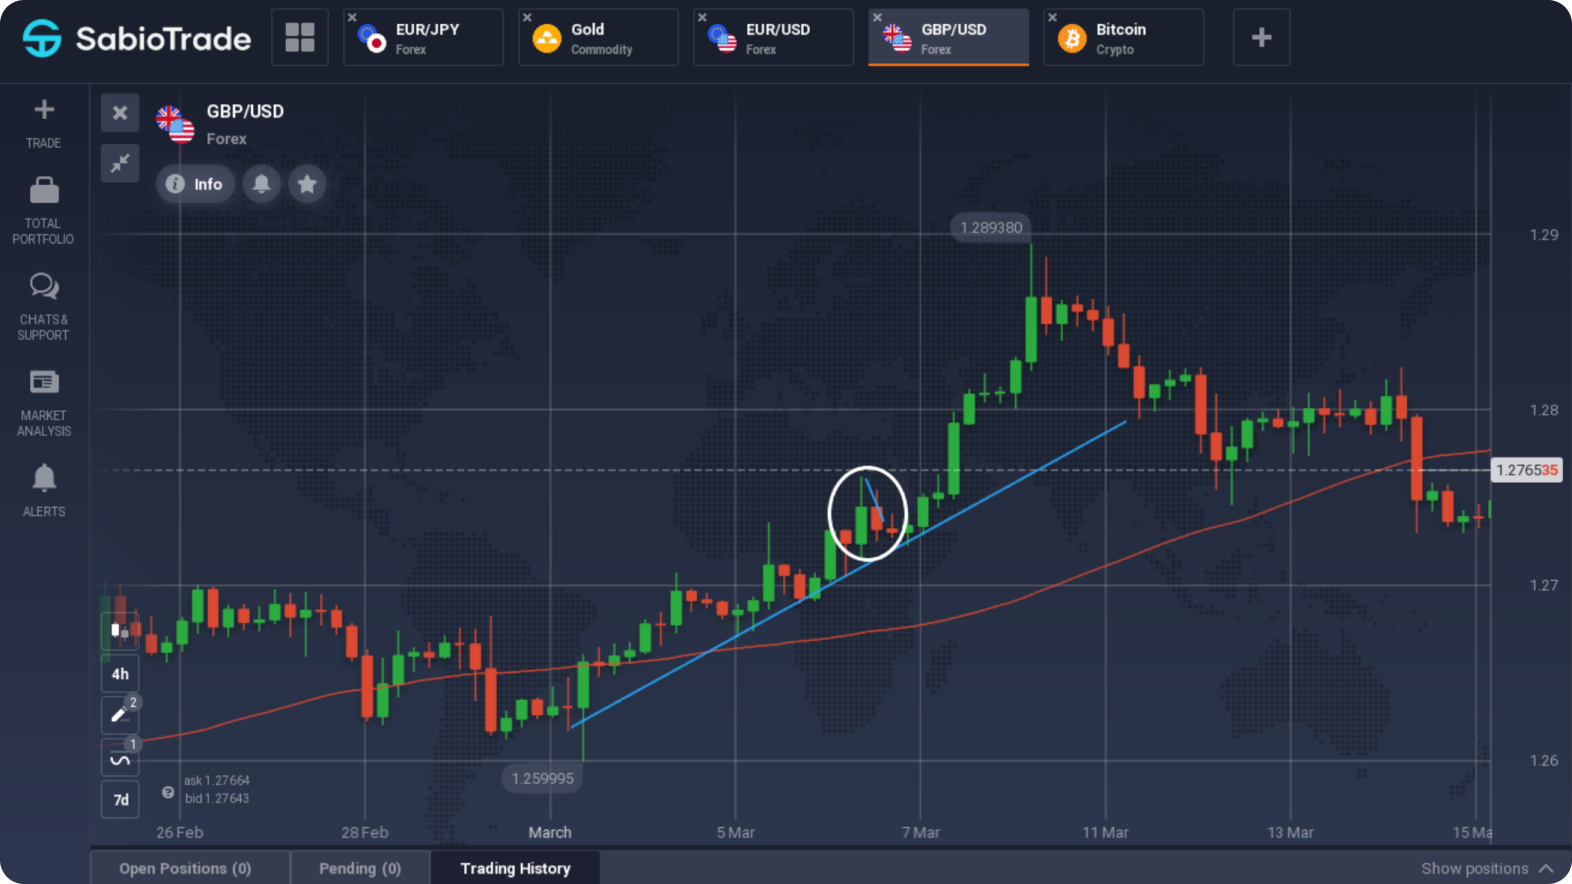
However, if you look at the “global” picture on the 4H timeframe, you can see the following scenario:
Example of a “Global” View of the Situation
A section of the price chart highlighted in red, which in the zoomed-in view (30M timeframe) from the previous example appeared as a strong downward trend, is seen in this chart as merely a minor pullback within a larger upward trend. Thus, misidentifying the trend could lead to making a wrong decision and, as a result, incurring losses.
In this scenario, by examining the chart on a 4H timeframe, a trader could identify the long-term upward trend and, by using the pullback to the ascending support line (trend line), enter the market to buy GBPUSD and secure a substantial profit.
The most common and reliable strategy for trading with trend lines is definitely trading along with the trend. When an upward trend is identified and an ascending support line (trend line) is drawn, buy trades are opened on pullbacks to this line. They can be closed at the ascending resistance line or based on individual calculations and forecasts.
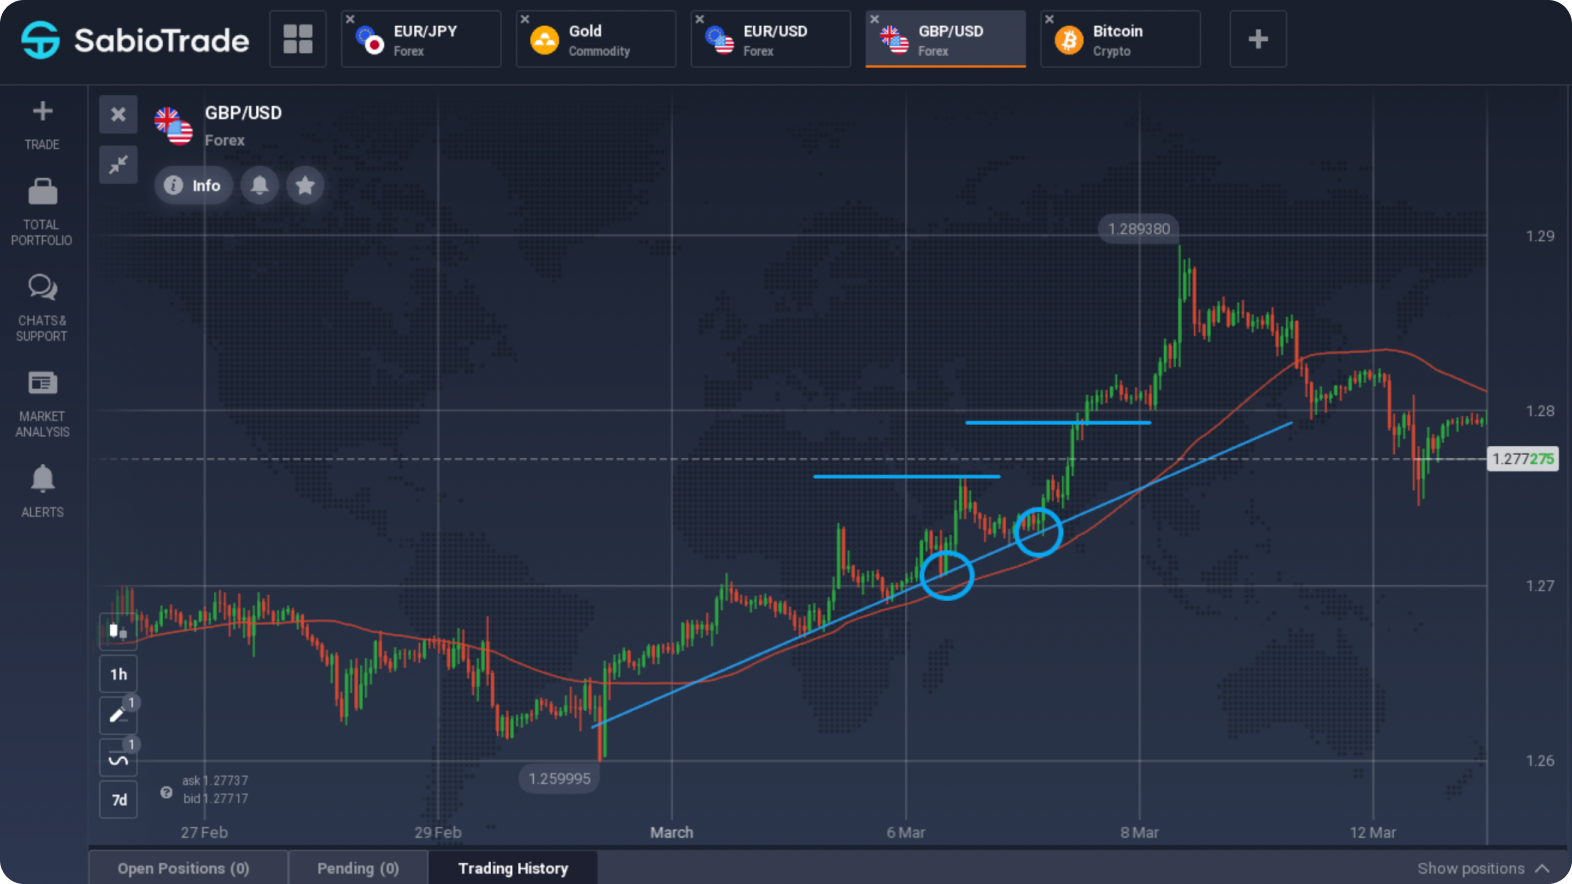
Solid Upward Trend is Evident on the EUR/USD chart.
Looking at the EUR/USD 1H chart, we see a strong trend going up. This trend got the green light after the line at the bottom was hit three times, which might have been a hint to consider buying. Whenever the price dropped back to this line, it was a good chance to jump in for a longer play. You’d want to set your safety net (stop-loss) just a bit lower than this line, just in case the price decides to dip a bit more. For deciding when to take your winnings (profit targets), look at where the price bounced back up before (those straight lines across). Basically, this situation looked pretty good for making some profit with not too much risk.
Here’s an example of selling during a downtrend:
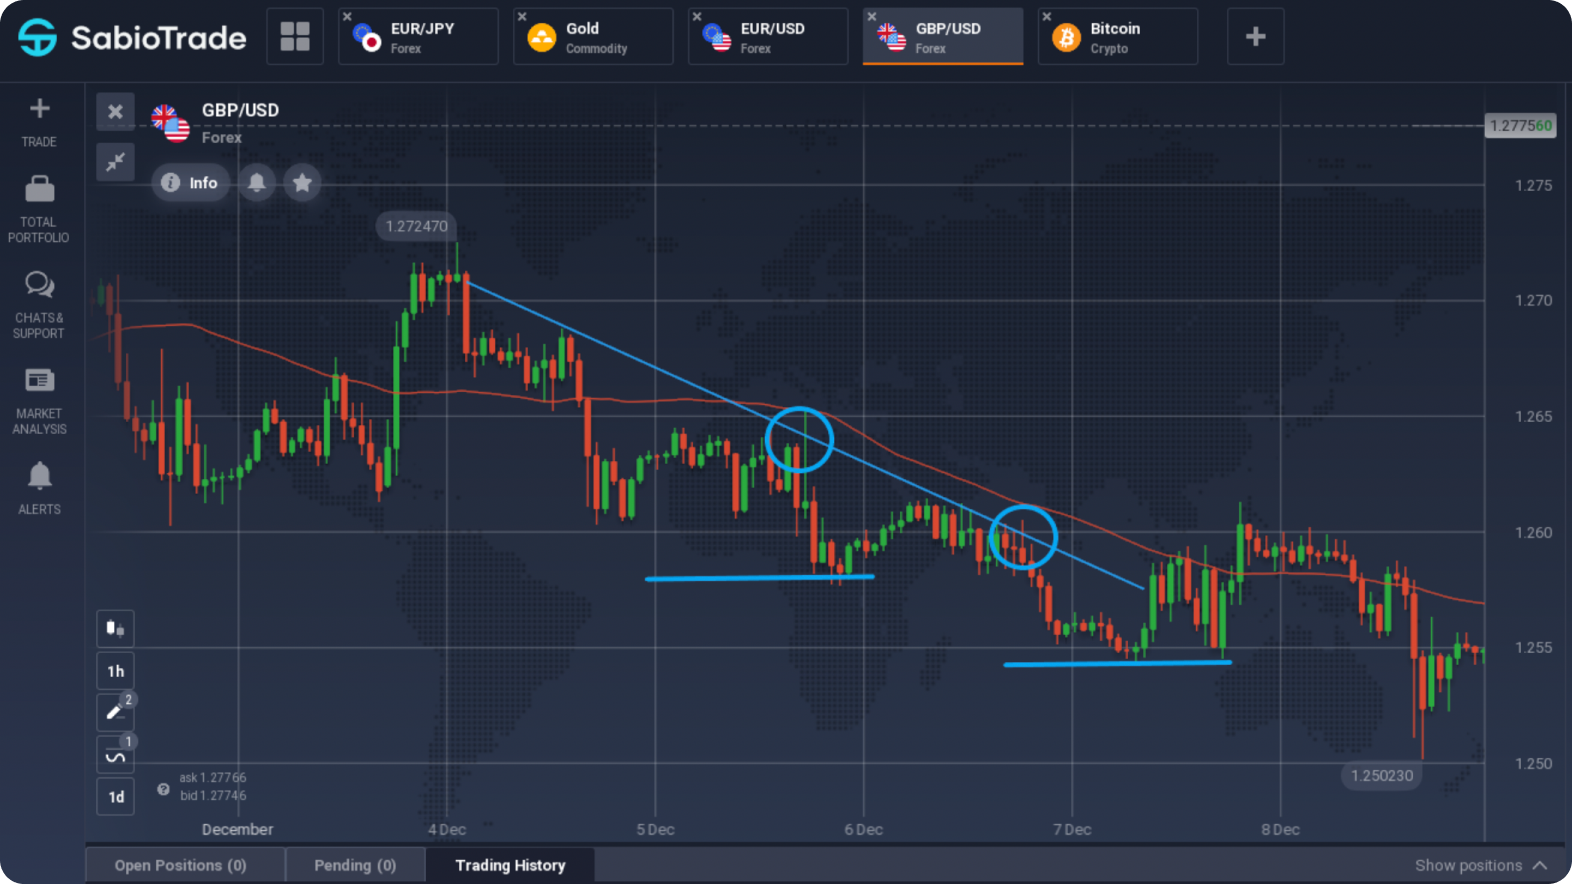
For beginners, the clearest choice is to stick with trading along the trend, especially when prices bounce back towards the trend line. This method is less risky compared to others, making it more suitable for those just starting out, while the riskier strategies are generally left to the more experienced traders.
The biggest perk of trading with a trend line is how simple and reliable it is. For traders who’ve got their strategy down, spotting and drawing a trend line at the start or resurgence of a trend is no big deal. The game plan is to watch for dips back to this line and then make your move, following the trend’s direction, without needing extra indicators or complex patterns.
It’s the essence of keeping things simple in trading, but of course, there’s always a but. The old-school term “tar” might not ring a bell for many and certainly doesn’t help in catching trends, but that’s beside the point here. For the short-term traders among us, like those who day trade or scalp, sticking just to a trend line might not cut it. That’s because the short-term market can be pretty erratic, and calling these quick changes “trends” might be pushing it.