Flag Pattern: How to Define and Trade


The flag pattern, a standout among chart patterns, signals a trend continuation, making it a favorite among traders for its ability to mark the best moments for entering the market. This pattern, resembling a flag on a pole, not only offers a visual cue for the continuation of a bullish or bearish momentum but also boosts the probability of accurately gauging a stock’s future movement. Yet, the practical application of identifying and trading this pattern, particularly for those new to trading strategies, can be somewhat tricky.
Esteemed in the realm of technical chart patterns, the flag formation is celebrated for signaling the persistence of a trend, whether it be bullish or bearish. Its recognition is crucial for traders aiming to leverage trendline strategies, as it identifies prime trading setups, enhancing the chances of successful trade execution. However, the challenge often lies in the correct interpretation of the flag and pennant chart patterns, especially for novices, who must navigate the nuances of such technical analysis chart patterns to make informed trading decisions.
The flag pattern, a key player in the realm of technical chart patterns, acts as a beacon for trend continuation, often spotted after a notable price surge or drop. As prices adjust, forming two typically parallel lines that slope, we see a reduction in trading volume, painting a picture akin to a flag waving in the breeze – hence the name, flag pattern. This visual cue not only adds to the pattern’s allure but also its functionality in trading strategies.
Should a new flag form at a sharper angle than its predecessor, it subtly hints at the persistence of a robust trend, poised for further action. Recognized for their fleeting nature, flag patterns are pivotal in short-term trading scenarios, with traders eyeing M15 to H1 timeframes for spotting these formations. Yet, for the long-haul investor, these patterns are transient, rarely stretching beyond several weeks.
In the throes of a vigorous trend, the flag pattern shines, especially as traders lock in profits, momentarily reversing the price flow. This scenario offers a golden window for entering trades at a vantage point, applicable in both rising and falling markets. This versatility makes the flag pattern a favored tool among traders, blending the art of price action trading with the precision of technical analysis to forecast price movements and identify high-probability trade setups.
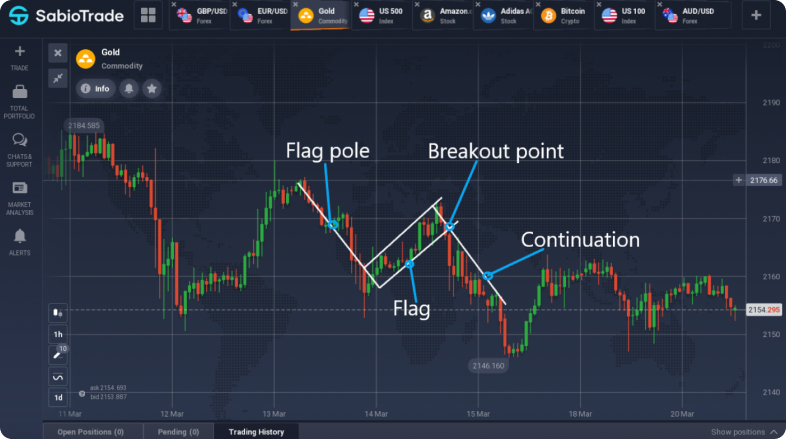
The “Flag” chart pattern consists of four separate parts:

Gold 1 H Graph
Depending on the trend direction, there are bearish and bullish flag patterns.
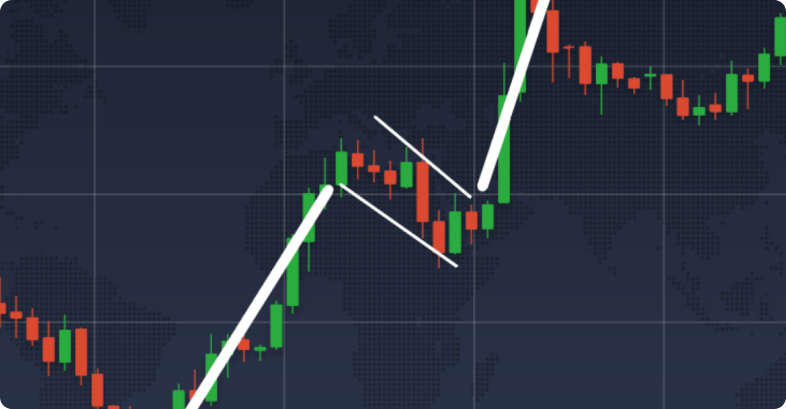
The bullish flag pattern emerges after a strong uptick in prices, leading to a downward-sloping channel on the chart that adjusts the initial spike. This less intense movement hints at a probable resistance breach and a resumption of the prior trend. Pinpointing the exact number of attempts required to surpass the channel’s limits is tricky, yet seasoned traders believe a minimum of two contacts with each boundary is necessary. This scenario underscores the pattern’s role as a powerful tool in trading strategies, offering a glimpse into the trend’s strength and potential for continuation. Utilizing this pattern, traders can identify high-probability entry points for trading the flag pattern, aligning with the best practices of price action trading and technical chart pattern analysis.

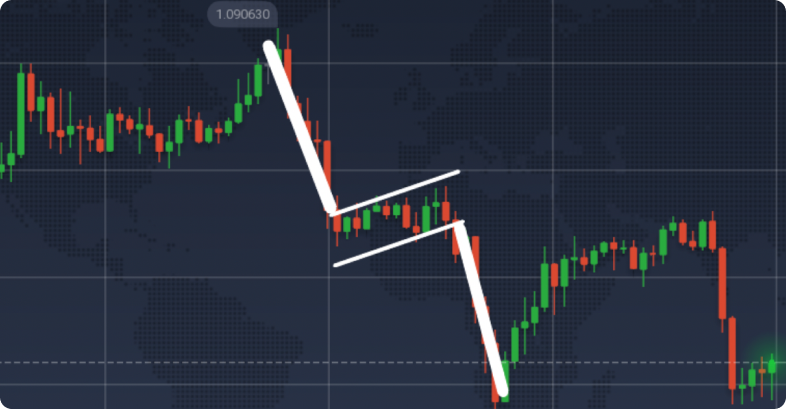
A bearish flag emerges during a downtrend, marked by a brief period where prices inch higher, creating a pattern of increasing peaks and troughs. This pattern, characterized by lengthy candlesticks and minimal wicks, signals the market’s bearish sentiment. A minor retracement in this context often represents short-term traders cashing in, only for the trend to resume its descent assertively. This scenario, a classic example of bearish continuation, highlights the flag pattern’s utility in identifying potential trading opportunities, particularly for those adept at interpreting such technical chart patterns.

To enhance the likelihood of a successful trade and accurately identify the “Flag” pattern from technical analysis, it’s essential to understand its components.
As mentioned earlier in the article, let’s solidify this. The “Flag” figure in technical analysis comprises:
Let’s analyze the “Flag” figure in Forex and figure out how to trade it.
It’s important to emphasize that this model exclusively appears after an impulsive movement. Don’t get it wrong; not every impulsive move will be followed by this pattern, but it’s a possibility.
Open a chart and see for yourself; there are plenty of descending and ascending channels. Can all of them be identified as our models? That’s why it’s crucial to check if there was an impulse before the channel. If there was an impulse, we’re likely dealing with a “Flag.”
What constitutes an impulsive movement is probably clear. It can occur after prolonged consolidation, at the change of a trend, or at the moment news is released.
After the impulse, the market quiets down and gradually retraces its initial surge. As mentioned before, the correction could serve various purposes, but for us, the key is to account for it in our plans.
The logical conclusion of a bullish flag is a breakout upwards, while for a bearish flag, it’s a breakout downwards.
Are there exceptions? Certainly. That’s why it’s crucial to set a StopLoss, but more on that later.
A common question regarding the breakout of anything – channels, trends, levels, etc., is how to know if it’s a genuine breakout or a false move?
Explaining something that has already happened is straightforward. There could be a million reasons why it should have been identified as a false move or a genuine one. This is how experience accumulates.
When dealing with the “Flag” figure in technical analysis, it’s better to follow this logic:
If it’s a bullish flag, it likely means there will be a breakout upwards, and you shouldn’t hesitate to open buy positions. If it’s a bearish flag, it likely means there will be a breakout downwards, and you shouldn’t hesitate to open sell positions.
Let’s structure the knowledge gained and formulate rules for breaking the “Flag” pattern in Forex:
1. What is a Flag Pattern in Technical Analysis? A flag pattern is a technical chart pattern that resembles a flag on a pole and is considered a continuation pattern. It forms after a sharp movement in price, followed by a consolidating rectangular shape that slopes against the trend direction. This pattern is used to identify potential trading opportunities, signaling either a bullish or bearish continuation based on the flag’s orientation.
2. How Do You Trade a Bullish Flag Pattern? Trading a bullish flag pattern involves identifying a strong upward price movement (the flagpole), followed by a slight downward consolidation (the flag). Once the price breaks out of the flag portion to the upside, it suggests a continuation of the bullish trend. Traders often enter a bull flag trade at the breakout point, setting a stop-loss just outside the flag to manage risk. The bull flag chart provides a visual guide for this strategy, with the target profit often set at a distance equal to the flagpole’s height added to the breakout point.
3. Can You Explain the Difference Between Bullish and Bearish Flag Patterns? Bullish and bearish flag patterns are inverse to each other. A bullish flag occurs during an uptrend, where the flag slopes downward before breaking out upwards, continuing the trend. Conversely, a bearish flag forms during a downtrend, with the flag sloping upward before the price breaks down, signaling a continuation of the bearish movement. Both patterns are characterized by a flagpole (initial price surge), a flag (consolidation), and a breakout (trend continuation), but they indicate opposite directions of market momentum.
4. What Are Some Key Considerations When Trading Flag Patterns? When trading flag patterns, it’s crucial to wait for the pattern to fully form and confirm the breakout before entering a trade. This ensures that you’re not caught in a false breakout. Additionally, analyzing the volume pattern can provide insights; typically, volume increases during the formation of the flagpole, decreases during the formation of the flag, and picks up again at the breakout. Establishing a strategy for trading such patterns involves setting clear entry and exit points, using the flag and pennant chart patterns to guide trading strategies, and being mindful of the risk/reward ratio to maximize potential gains while minimizing losses.