The 10 Best TradingView Indicators for Day Trading

Day trading is an exhilarating but also extremely challenging way to navigate financial markets. With price action rapidly changing within a single trading session, day traders must have the best tools available to be able to make prompt and well-informed trading decisions. This is where TradingView, a powerful charting and analysis platform, offers a significant advantage. It has an extensive library of technical indicators that can help you decipher market movements and identify profitable entry and exit points.
TradingView offers a wide range of free and premium indicators, from the basics to sophisticated custom indicators created and shared by its large user base. In this article, I intend to present to you the top 10 best TradingView indicators for day trading and show you how integrating them into your trading strategies can improve your trading results significantly. Choosing the right technical indicators aligned with your specific trading style is key to finding success.
From trend-following indicators to volume profile indicators, as well as those signaling overbought and oversold levels, we are going to explore in-depth how these tools may help you in making better-informed trades. Keep reading if you’re looking for the best day trading tools and are eager to discover the best TradingView indicators to enhance your technical analysis game and take you on a successful trading path.
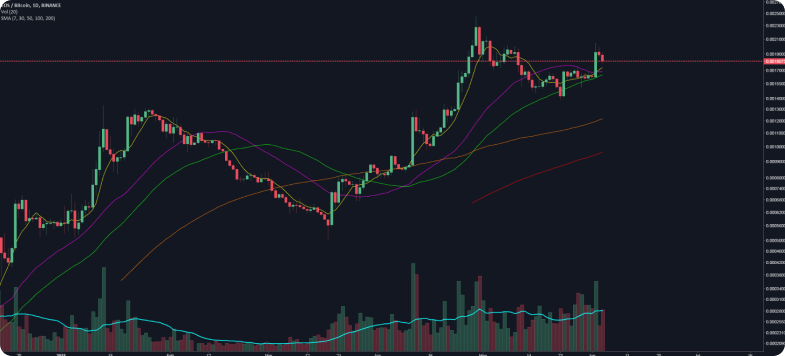
One of the most popular indicators is the moving average, also referred to as MA or EMA. It’s a trend-following technical indicator that smooths out price data by calculating the average price over a chosen period, such as 50 or 200 days, minutes, and hours, among others. Essentially, it creates a constantly updated trendline reflecting the average price movement. As new price data comes in, the oldest data point drops off, keeping the moving average focused on the most recent price trend and action. It is also very flexible, giving users the ability to use simple moving averages and exponential moving averages to prioritize the most recent events.
This smoothed trendline helps traders identify excellent entry and exit points. A rising moving average suggests an uptrend, potentially indicating a good time to buy. Whereas, a falling moving average might signal a downtrend, prompting a sell decision. Traders can also use multiple moving averages with different timeframes to gauge momentum and potential trend reversals. By providing visual cues based on past price movements, moving averages can be a valuable tool for day traders navigating the fast-paced world of short-term price action.
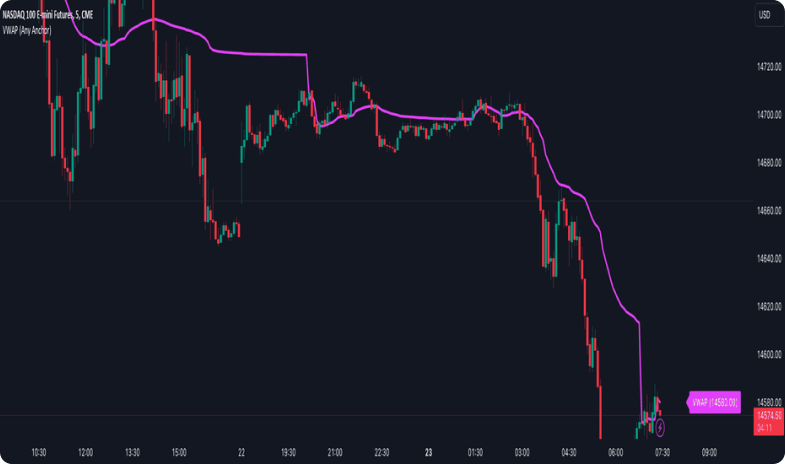
VWAP is another great indicator on TradingView to understand price trends. It takes the average price of the asset, but instead of simply averaging all the closing prices, it is volume weighted. In simpler terms, candles with higher trade volume have a greater impact on the VWAP calculation.
The VWAP indicator can act as a benchmark for traders. If the current price is above the VWAP, it suggests buying may have been dominant during the session, potentially indicating upward pressure. Conversely, a price below the VWAP suggests selling pressure might be stronger. Traders can use this information to optimize their entry and exit points for trades by using the VWAP as support and resistance levels or even use it for a mean-reversion strategy.
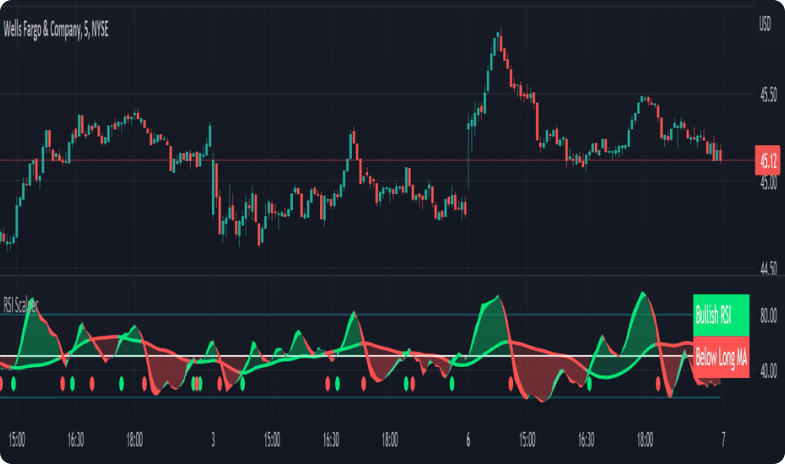
The RSI indicator belongs to the class of oscillators, which are indicators that fluctuate within a defined range, aiding the trader to determine if an asset is overbought or oversold, and helping them find opportunities to buy and sell.
This indicator focuses on the magnitude of recent price gains and losses over a set period, which is usually the last 14 periods. It ranges from 0 to 100 and an RSI above 70 may indicate an overbought market, where assets start to get into inflated price territory, which may favor a correction. On the other hand, an RSI below 30 may suggest an oversold market, which can serve as a buy signal, since the asset may be undervalued.
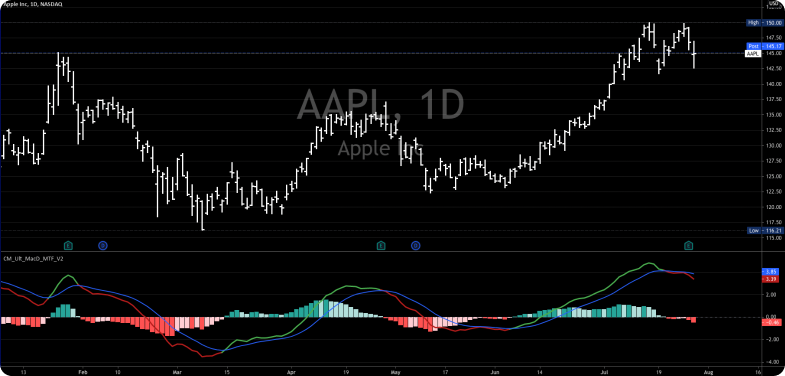
The MACD is a trend-following momentum indicator that also belongs to the class of oscillators. It consists of two Exponential Moving averages and a histogram. The MACD line itself is the difference between a faster 12-period EMA and a slower 26-period EMA, highlighting changes in momentum. Averages smooth price changes, so the MACD line’s movement above or below zero reflects the overall strength of a trend.
The MACD also incorporates a 9-period EMA of itself, called the signal line. When the MACD line crosses above the signal line, it can be interpreted as a bullish signal, suggesting potential for price increases. On the other hand, a crossover below the signal line might indicate weakening momentum and a potential downtrend. The histogram adds another layer of analysis by allowing you to visualize the difference between the MACD line and the signal line. Expanding bars suggest strengthening momentum in the direction of the MACD line. By combining these elements, traders can use the MACD to gauge trend direction, assess the strength of price movements, and find the best entry and exit signals.
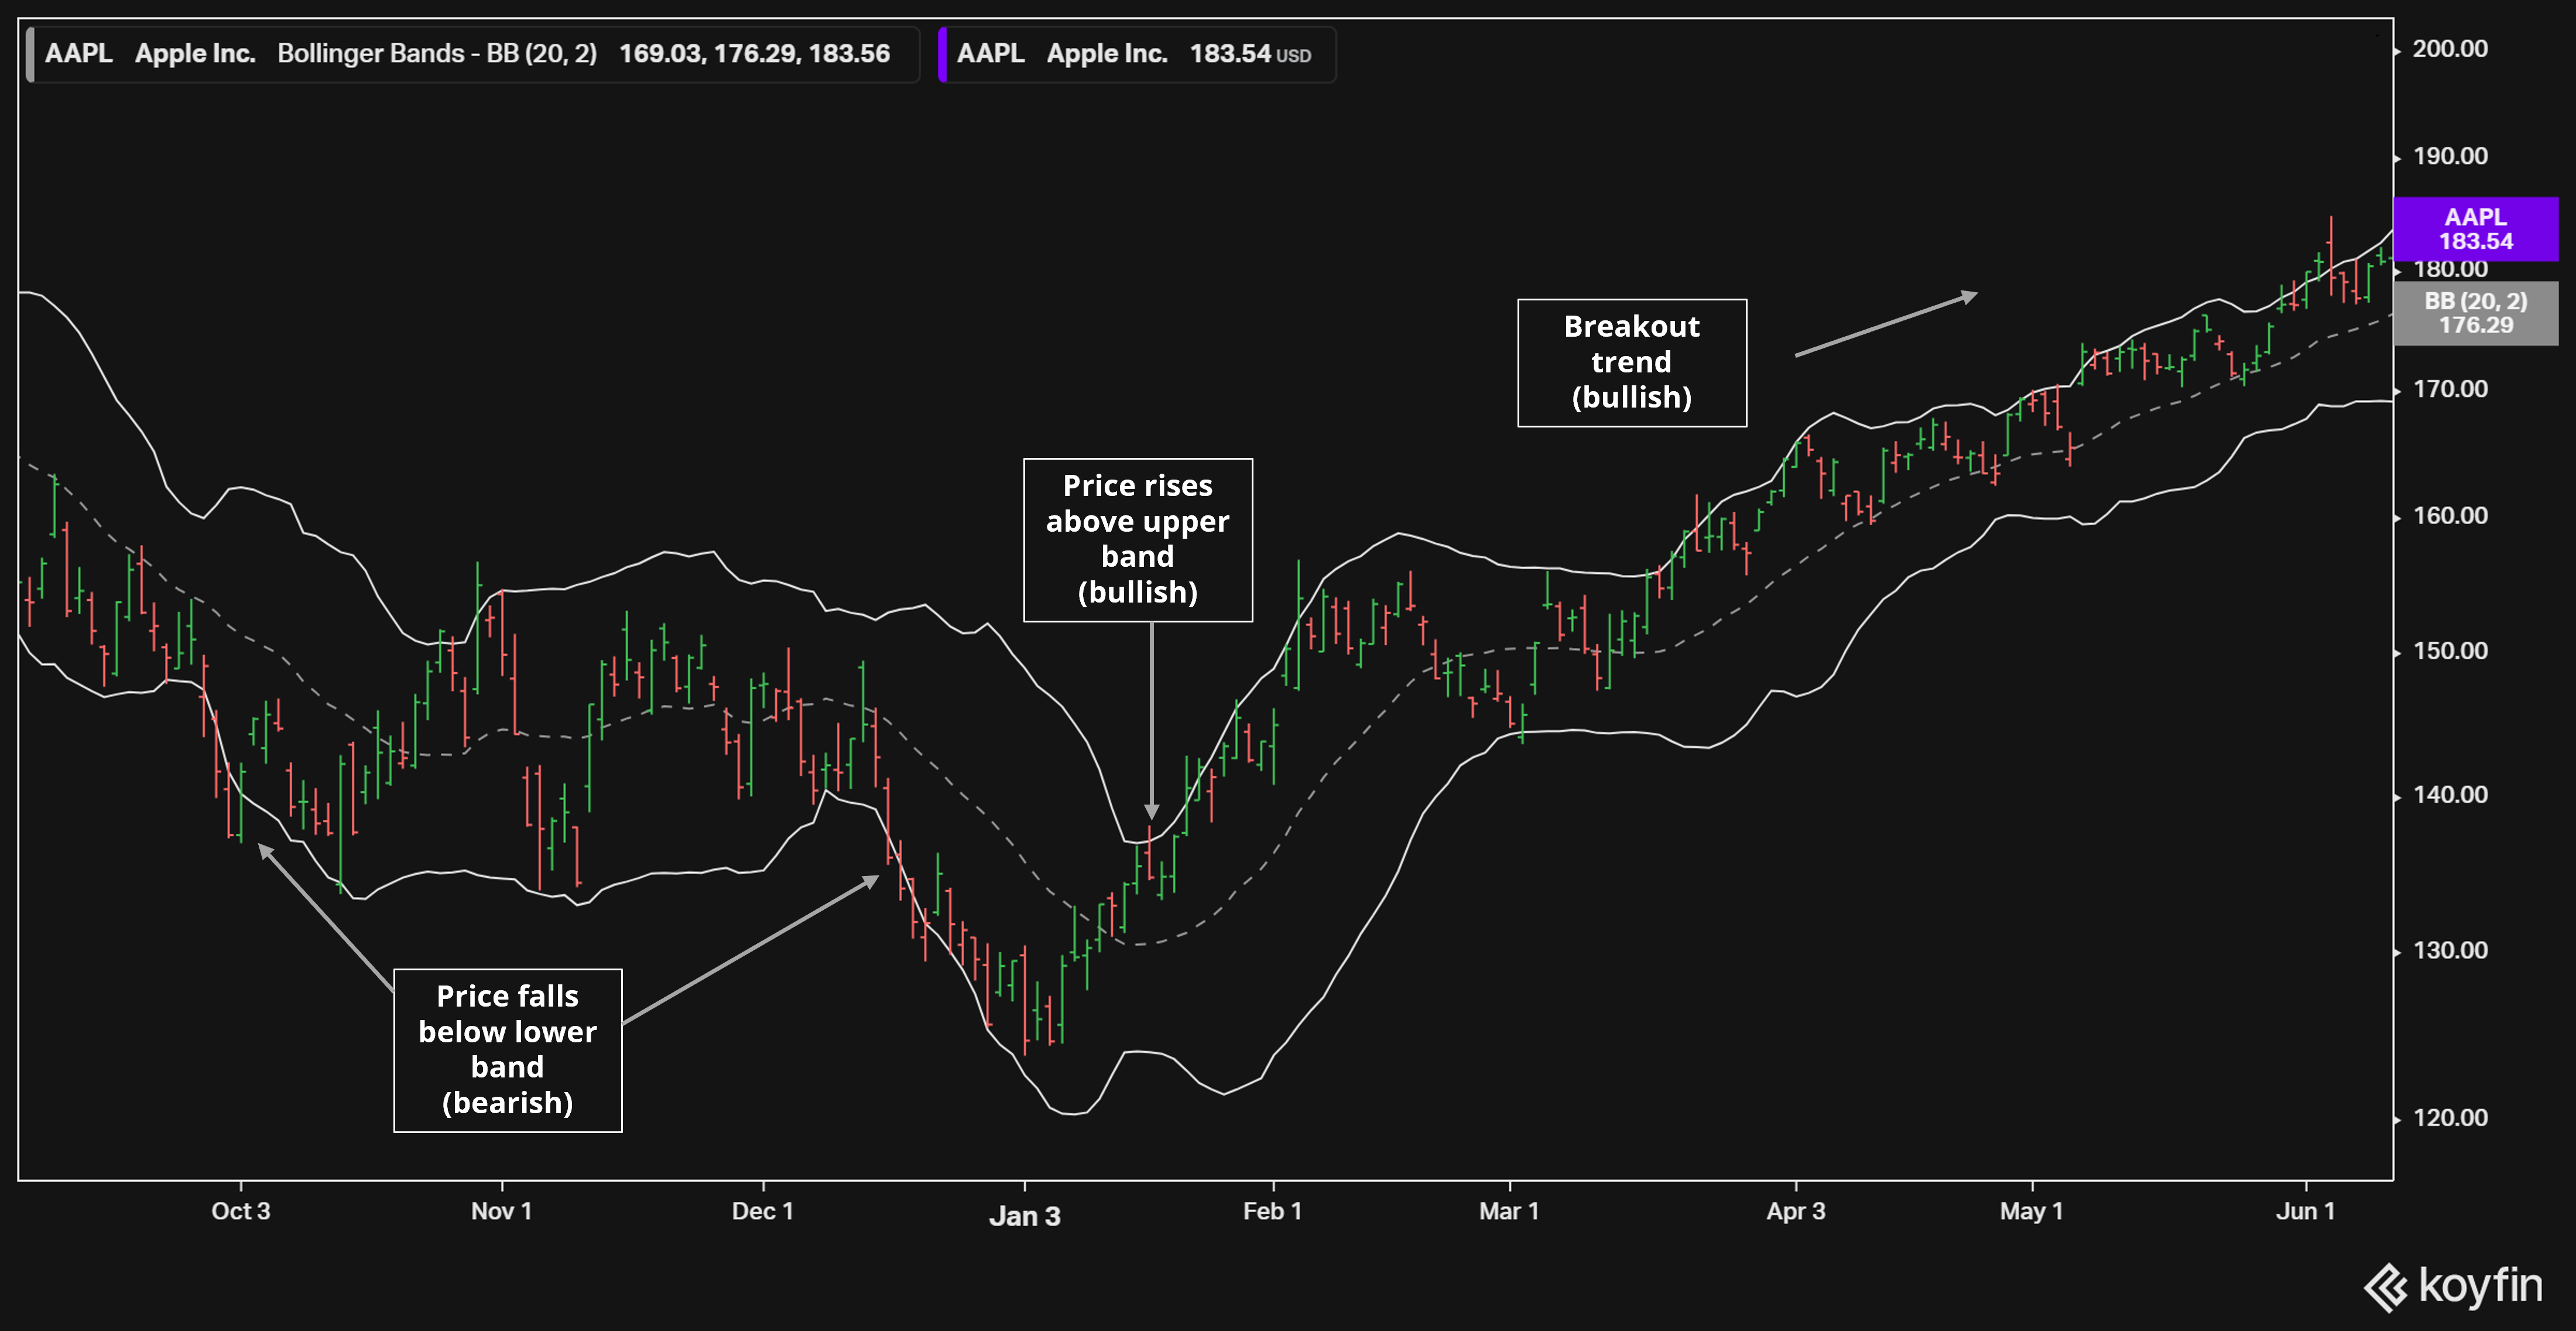
The Bollinger Bands are a volatility indicator that consists of three lines: a simple moving average in the center, and two bands plotted above and below the MA at a distance determined by the standard deviations. Standard deviations measure how much prices typically change over time, making the Bollinger Bands a great indicator to capture market volatility.
When volatility is high, the bands naturally widen, and when it’s low, they contract. Prices hugging the upper band may suggest an overbought market, while prices near the lower band could point towards oversold conditions. Additionally, breakouts above or below the bands can signal potential momentum for a new trend. This is one of the best indicators available, being one of the favorites among beginners and advanced traders alike.
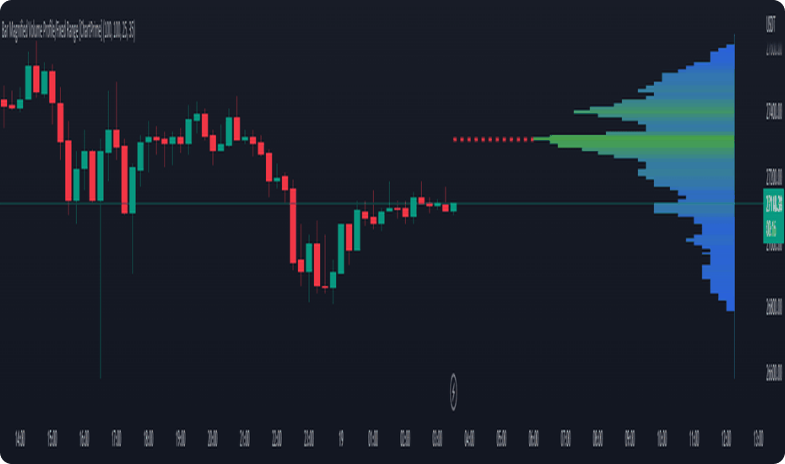
Unlike traditional volume bars that simply show the total volume traded over a certain time frame, the volume profile displays volume across different price levels working as a histogram on the side of the chart. Using this indicator, traders can easily identify possible support and resistance levels.
Overall, high volume zones on the chart represent price levels where a significant amount of trading activity occurred. These zones can act as support if the price dips and encounters buying interest at those levels, or resistance if the price rises and meets selling pressure. Areas with low-volume trading may indicate less resistance to price movements. This indicator helps traders identify entry and exit points based on the interest of the market over a certain price level, targeting to buy around support zones and identify resistance zones as a good time to sell.
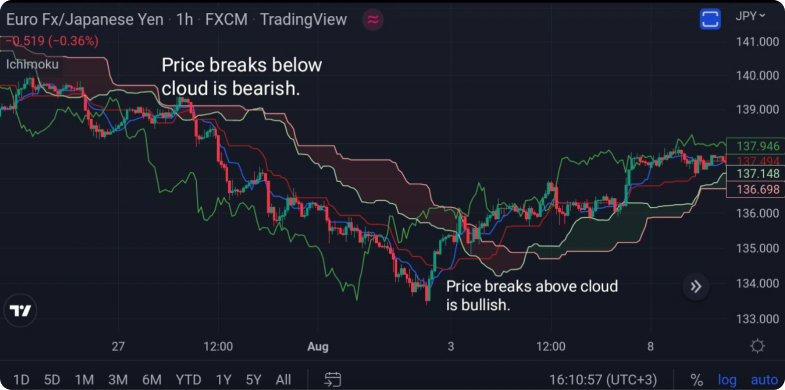
The Ichimoku Cloud is a complex technical indicator that offers a comprehensive view of the market at a single glance. Unlike simpler indicators, it incorporates multiple components to offer a well-rounded perspective on trends, support and resistance levels, and momentum.
The Cloud, or Kumo, is the most defining feature of the Ichimoku indicator. It’s formed by two lines – Senkou Span A and Senkou Span B. If the price is above the cloud, it’s considered a bullish signal, while a price below suggests a bearish sentiment. The thickness of the cloud provides insights into the strength of support or resistance levels. Additionally, the Ichimoku includes the Tenkan-sen (fast MA), Kijun-sen (slower MA), and the Chikou Span (lagging closing price line). Traders may analyze the crossovers between these lines, along with their positions relative to the cloud and the current price, to identify potential buy signals and sell signals, as well as obtain insights into the strength of price momentum.
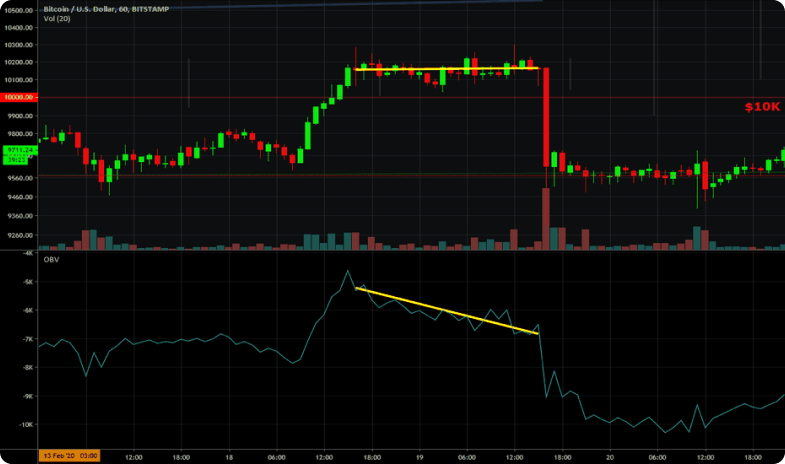
The On-Balance Volume is yet another indicator that falls under the category of momentum oscillators. Unlike many volume-based indicators that simply show the total volume traded, the OBV focuses on the relationship between volume and price changes. It is a cumulative total, meaning it starts with a baseline value and is then adjusted based on the most recent price movements within the time frame. This creates a line that oscillates over time, reflecting the underlying buying and selling pressure in the market.
This indicator can provide a simple and effective way of identifying potential trend reversals. By analyzing divergences between the OBV line and the price chart, traders can obtain valuable trading signals. If the price keeps making new highs but the OBV fails to follow suit, it suggests weakening buying pressure and a potential trend reversal. Similarly, a price dipping to new lows while the OBV doesn’t confirm the decline might indicate hidden buying interest and a possible trend change upwards. While the OBV itself doesn’t provide definitive buy or sell signals, it offers valuable clues about market sentiment, making it a quiet but powerful tool, especially for day traders who need to react quickly to shifting market dynamics.
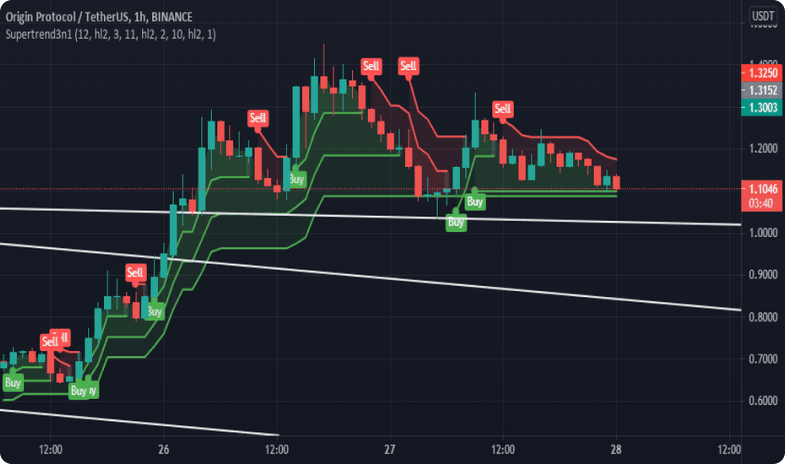
The Supertrend indicator is yet another versatile trend-following tool that can be highly valuable for day traders. Unlike some more complex trend indicators, the Supertrend offers clear visual signals by superimposing a single line directly onto the price chart. This line dynamically changes color and position, flipping from below the price in an uptrend, acting as a support level, to above the price in a downtrend, acting as a dynamic resistance level.
Here’s how the indicator works: It incorporates the Average True Range to adjust its sensitivity based on market volatility. Traders can customize their Supertrend indicator by adjusting the ATR period and the multiplier. By adjusting these settings, traders can make the Supertrend line react more quickly to price changes or create a smoother line that filters out some market noise.
Day traders benefit from the Supertrend indicator for several reasons. Its trend-following nature helps identify the dominant market direction. Secondly, the line itself acts as a potential support and resistance level, guiding both entry points and exit strategies. For instance, traders might look to enter long positions when the price dips to the Supertrend line during an uptrend, potentially using the line as a stop loss as well. They can also look for short entry points during downtrends when the price bounces off the line, using it to guide their take profit levels.

Pivot points are one of the most popular indicators due to their simplicity and focus on intraday high and low areas. The core of pivot point calculations revolves around the previous day’s High, Low, and Closing prices. Using these values, the indicator automatically plots several points on the current day’s chart, including a central Pivot Point, along with the daily resistance (R1, R2, R3) and support levels (S1, S2, S3).
The central Pivot Point can offer a directional bias for the day’s trend. If the market opens above the central Pivot Point, bullish sentiment is suggested, while opening below might indicate bearishness. The resistance and support levels act as potential turning points for the price. Traders might look to open long trades near support levels with targets at higher resistance, or open short trades near resistance with targets at lower support.
While relying solely on pivot points can be risky, this indicator works well in conjunction with other indicators, effectively helping traders make more informed decisions on their overall trading strategy.
A trading indicator is a mathematical calculation, usually represented as lines or other visual features on a price chart. They are derived from historical price data, volume, or open interest—the number of outstanding buy and sell orders—and aim to help traders analyze past trends to predict future market behavior.
While the strategies highlighted in the article provide a solid foundation, such as the 14-period settings for the RSI indicator, it is essential to customize and experiment with different settings (like timeframes and sensitivity levels) to align with your style and risk tolerance. Experimentation and backtesting are crucial before using indicators in live trading.
TradingView has a generous free plan that unlocks access to a wide range of basic and even some advanced technical indicators. You can start experimenting right away without any upfront cost. Paid plans do provide access to more sophisticated and customizable indicators, as well as the possibility of a larger number of different indicators on the same screen.
The key to using technical indicators successfully lies in combining multiple indicators, ensuring they complement each other rather than offering conflicting signals. For example, you could pair a trend-following indicator like the Supertrend with a momentum oscillator like the RSI. Look for consistent signals across indicators, and always consider the broader market context before making any trades.
TradingView is one of the best options for day traders and is also one of the most popular and feature-rich charting platforms. However, alternatives do exist, and it’s wise to explore different options. Some highly-known competitors include MetaTrader and TrendSpider. So don’t hesitate to research and compare features to find the best fit for your needs.