Understanding Swing Trading
Swing trading is all about taking advantage of market swings that occur in the span of a few days to a couple of weeks. Swing traders might use trend indicators or oscillators to measure when a stock is overbought or oversold and enter the trade when there are signs that a relevant swing is about to happen. To better understand swing trading strategies and style, let’s take a look at its core characteristics:
- Timeframe: Many swing traders operate on timeframes going from 4 hours to 1 week. They usually focus on positions that can be closed within 2–3 days to 2–3 weeks after being opened. They can, for instance, buy a stock that has pulled back to a support level and hold it for about 10 days as it swings up to a resistance level and then exit with a profit.
- Swing trading vs. day trading: While day trading involves executing many trades within a single day, profiting from intraday volatility, swing traders execute fewer trades, holding them for a few days. Unlike day trading, however, swing traders take on overnight risks.
- Swing trading vs. long-term investing: Swing traders will often open more positions than long-term investors. Long-term investing is also more dependent on fundamental analysis instead of technical analysis. Investors take on long-term risks (changes in a particular industry, macroeconomic data, etc.) but can have a more stable path towards profits when done right. Swing traders, however, may compound gains by trading more often while also increasing risk exposure.
- Focus on technical analysis: Swing trading strategies rely heavily on technical charts. Swing traders may use price patterns, trendlines, moving averages, oscillators, and other technical indicators to find setups where the probability of a swing up or down is in their favor. They also use a blend of indicators and signals, such as buying a stock when prices are near a known support zone, the RSI indicates oversold conditions, and prices are above a long-term moving average like 200. The combination of trend analysis, support and resistance levels, as well as momentum indicators, is typical in many swing trading techniques where positions are often opened based on technical signals.
- Market suitability: Swing traders operate across stocks, forex, crypto, and other markets. Given there is volatility and liquidity, there is the opportunity to profit from price swings. Volatility ensures meaningful price movements can happen, while liquidity ensures that entries and exits can be executed efficiently.
- Risk management: Swing trading risks involve overnight and weekend risks, where news and announcements can cause the market to gap up or down in unexpected ways. For this reason, it is necessary to use stop-loss orders and a correct position sizing. Swing traders often use volatility-based stop-loss orders (usually with the help of the ATR indicator) to avoid unexpected price movement that can jeopardize their trading accounts.
You can check our blog for reading more about the differences between day trading and swing trading, as well as checking this comprehensive approach to swing trading.
Top 7 Best Indicators for Swing Trading
Technical indicators are essential tools for swing traders. They help inspect price trends, momentum, volatility, and volume to decide on whether to enter or exit a trade.
There is no single magic bullet when talking about indicators. Swing traders often combine multiple of them to confirm their analyses and improve the odds of success. Let’s take a look at 7 of the best swing trading indicators you can start using today.
1. Moving Averages (MA)
Moving averages are behind any of the trend-following trading decisions. They are responsible for smoothing price data to reduce market noise and highlight the trend. The two most common indicators are the simple moving average (SMA) and the exponential moving average (EMA). The first is a basic average of prices over a period, while the latter prioritizes the most recent prices for faster responsiveness.
Formula:
SMA: SMA = (P1 + P2 + . . . + Pn) ÷ n (where P is price and n is periods)
EMA: EMA_today = EMA_yesterday + (K * (Price_today – EMA_yesterday)) (where K = 2 ÷ (n+1))
Moving averages are used as trend indicators, and their slope points out toward the direction. Price crossing above or below an MA can indicate trend changes. Crossovers between shorter MAs and longer MAs also generate well-known buy/sell signals (e.g., a “golden cross” happens when a 20-day SMA crosses above a 50-day SMA). MAs can also act as dynamic support and resistance levels, with many traders using them as a pullback entry sign when prices touch a rising MA in an uptrend before moving back up.
Swing traders tend to use a combination of MAs, usually using them in pairs (20-day; 50-day), mixing EMAs (for shorter averages like 10 or 20) and SMAs (for longer averages like 100 or 200) to measure the main trend and time their entries, or even using a ribbon of several EMAs to measure the strength of the trend (if all are aligned, the trend is strong).
Pros: MAs are simple and effective for trend identification. One of the best swing trading indicators to find dynamic support and resistance levels, helping traders identify relevant entry points.
Cons: MAs are lagging indicators, meaning signals can come after a move has begun, leading to late entries. They also tend to generate many false signals in sideways markets, providing more trustworthy trading signals where there is a clear trend.
2. Relative Strength Index (RSI)
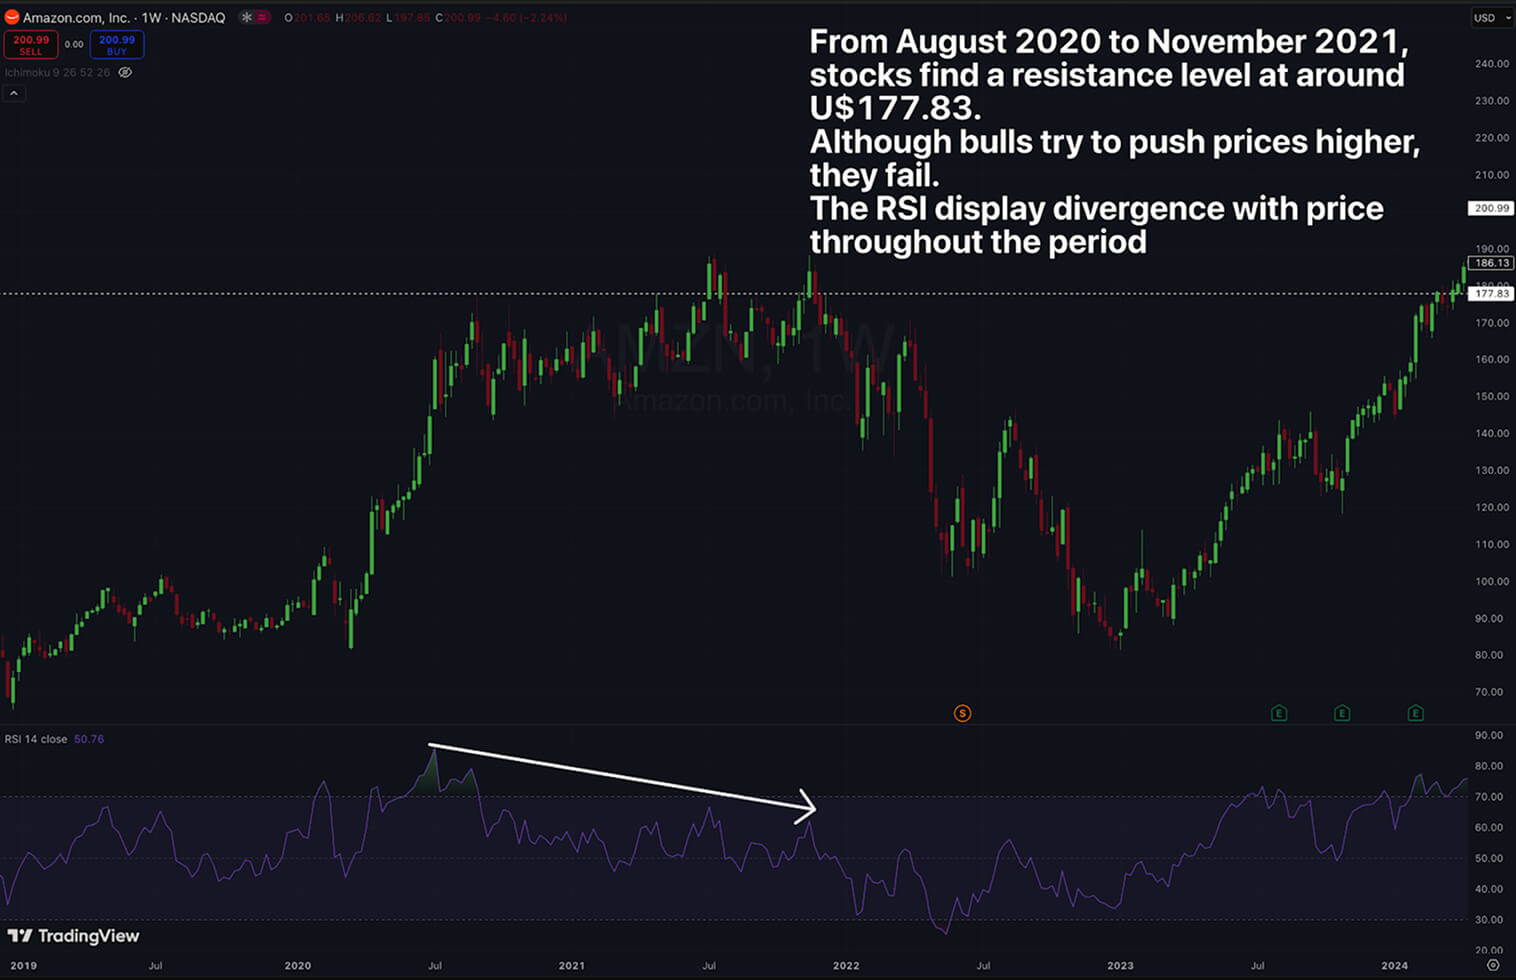
The Relative Strength Index, aka RSI, is a momentum oscillator developed by J. Welles Wilder Jr. It oscillates between 0 and 100, measuring the speed and change of price movements to identify overbought or oversold conditions. Values above 70 are seen as a signal that prices reached an overbought state and a downward correction might be near. Values below 30 indicate an oversold condition, implying a possible upward turnaround.
Formula:
The RSI calculation starts with computing the Relative Strength (RS) by dividing the average gain by the average loss over a specified period (14 by default). The final RSI value is then scaled using the equation below:
RSI=100−[100 ÷ (1+RS)]
This results in an oscillator that highlights strong upward momentum with high values and strong downward momentum with low values, with 50 as the midpoint, representing equal gains and losses.
Swing traders use the RSI in several key ways. They tend to seek a buying opportunity when it recovers from below 30 and seek a selling opportunity when it drops below 70. Traders also look for divergences between price and indicator. When prices are making lower lows but the RSI is making higher lows, a bullish swing can be expected, especially if prices are around a support level. You can read more about strategies based on RSI divergence here.
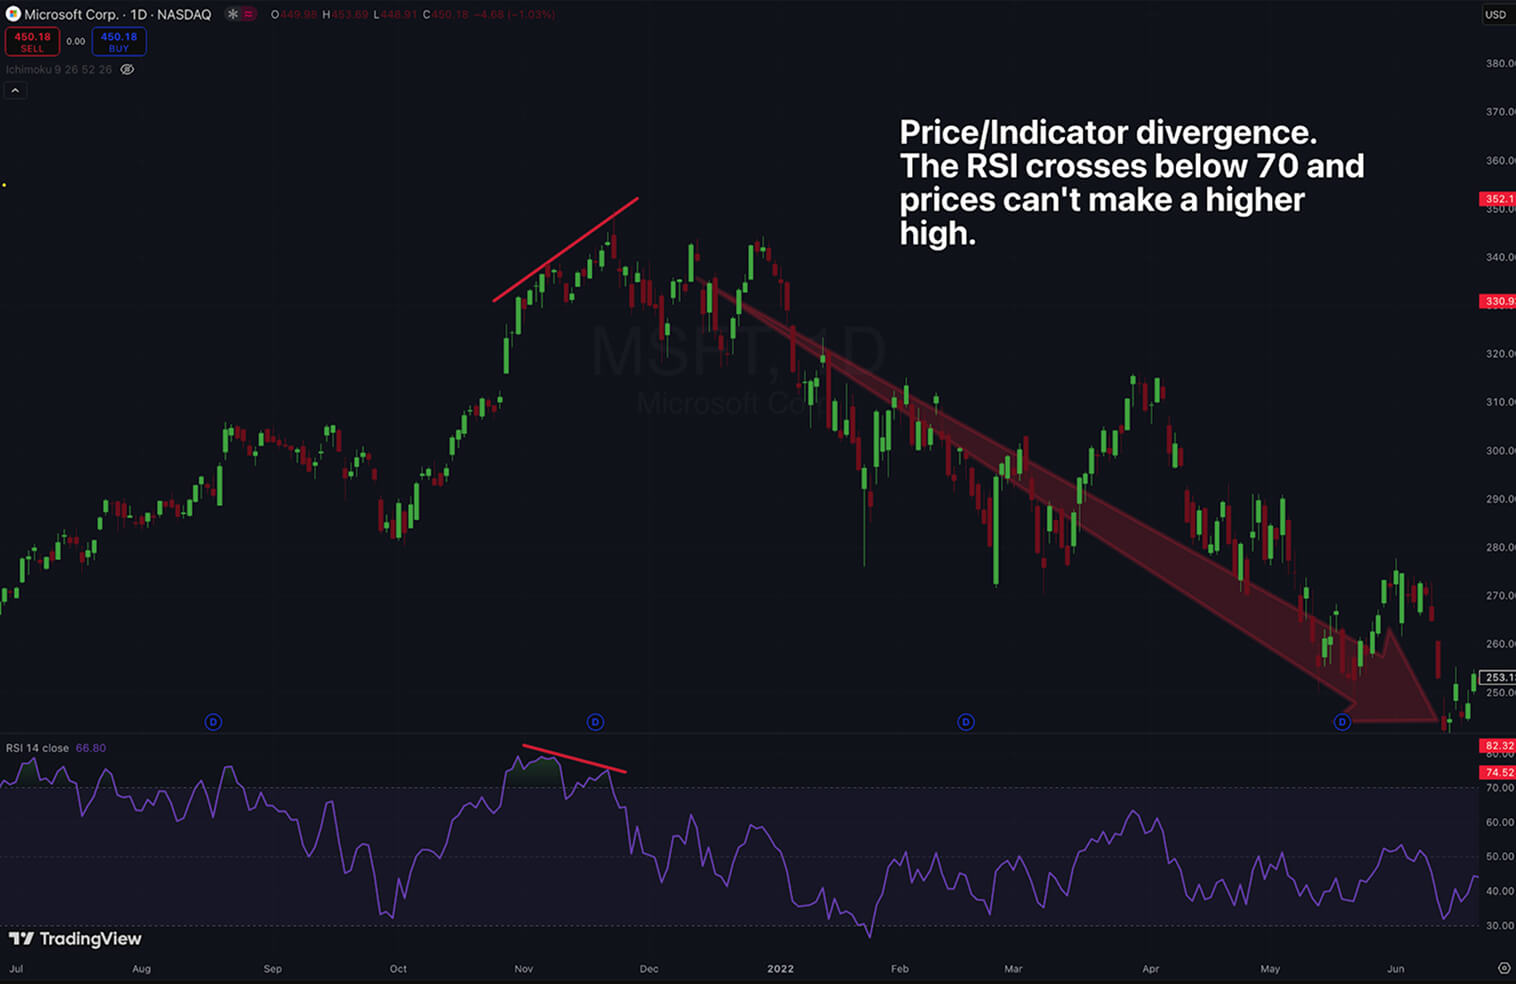
Pros: the RSI often indicates reversals before price confirms. It also provides quantifiable momentum levels and is versatile enough to be able to confirm trends while also warning of reversals. For swing traders, it’s considered one of the best indicators for identifying overbought/oversold conditions and timing entries/exits.
Cons: like other oscillators, the RSI can generate many false signals, especially in strong trends. Prices can remain under overbought or oversold conditions for extended periods. Although divergence signals are powerful, they are not accurate all the time. The RSI is also solely price-based and doesn’t factor in other important elements like volume, so it’s usually best used in conjunction with other indicators for signal validation.
3. Moving Average Convergence Divergence (MACD)
The Moving Average Convergence Divergence (MACD) is an indicator that blends trend-following and momentum analysis. It has three main elements:
- The MACD line: the difference between two moving averages, usually EMAs.
- The signal line: the EMA of the MACD line
- A histogram: the difference between the MACD and signal lines.
Formula:
Considering a common default settings (12, 26, 9):
- 12-period EMA of price
- 26-period EMA of price
- MACD Line = 12-EMA – 26-EMA
- Signal Line = 9-period EMA of the MACD line
- Histogram = MACD line – Signal line
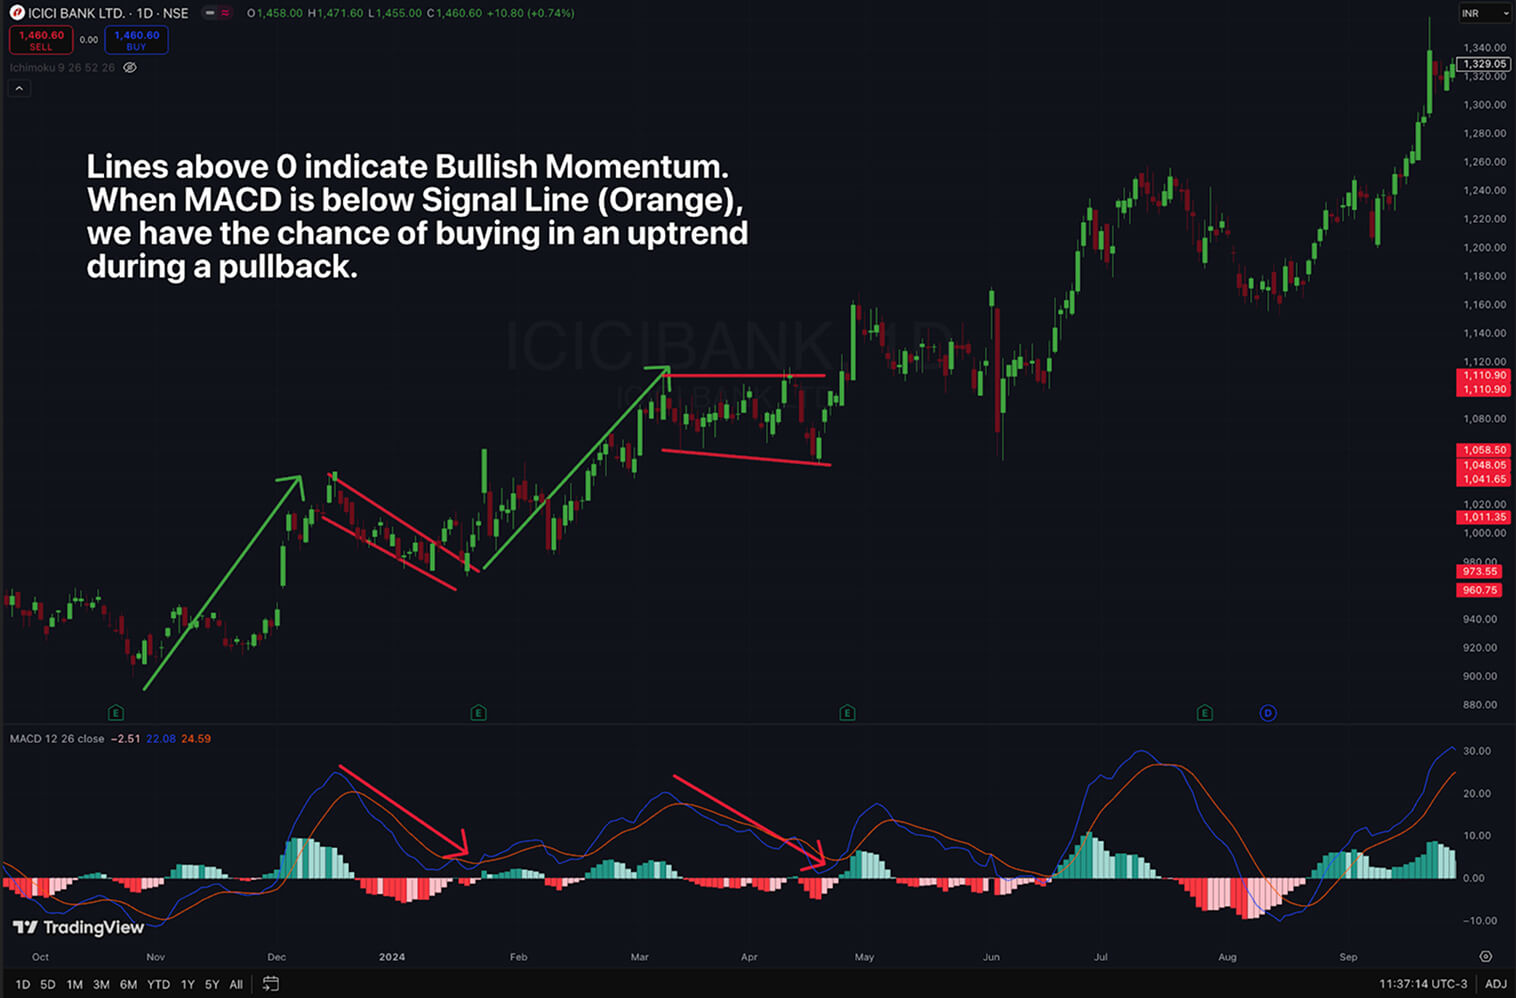
Swing traders use the MACD to identify momentum and trend direction through key signals like crossovers between lines and divergences. A bullish signal occurs when the MACD line crosses above the signal line, while a bearish one happens when it crosses below. Crosses above or below the zero line confirm trend direction. Histogram bars can also give interesting insights, with expanding bars indicating strong momentum and shrinking ones suggesting a slowdown.
Similarly to the RSI, divergences between price and MACD warn of reversals. Many traders combine MACD with support and resistance levels or candlestick patterns, such as the flag pattern, for additional confirmation. Although the default settings work quite well, traders tend to tweak them to get quicker signals based on market volatility, asset behavior, timeframe, and personal trading style
Pros: highly versatile indicator, combining trend and momentum analysis while generating clear signals. Accessible for beginners, helping them confirm trend direction and momentum shifts for entries and exits.
Cons: also considered a lagging indicator due to the fact it is based on moving averages, so their signals can sometimes come only after a significant price move. It doesn’t work that well in sideways markets, and it doesn’t offer clear overbought or oversold levels like other oscillators.
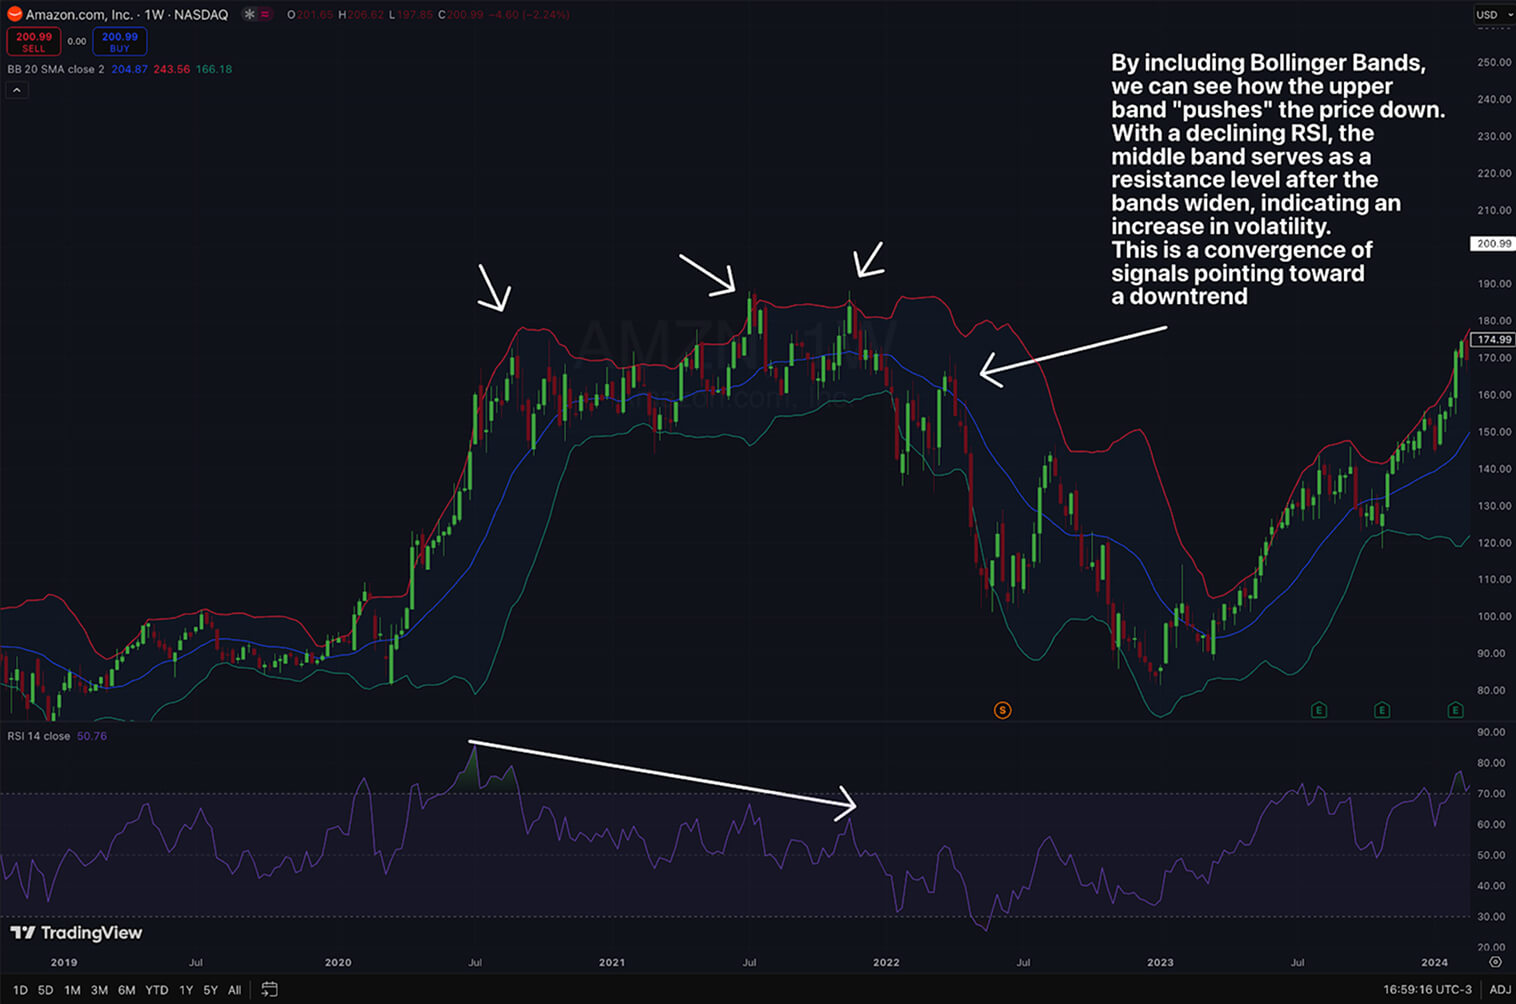
4. Bollinger Bands® (BB)
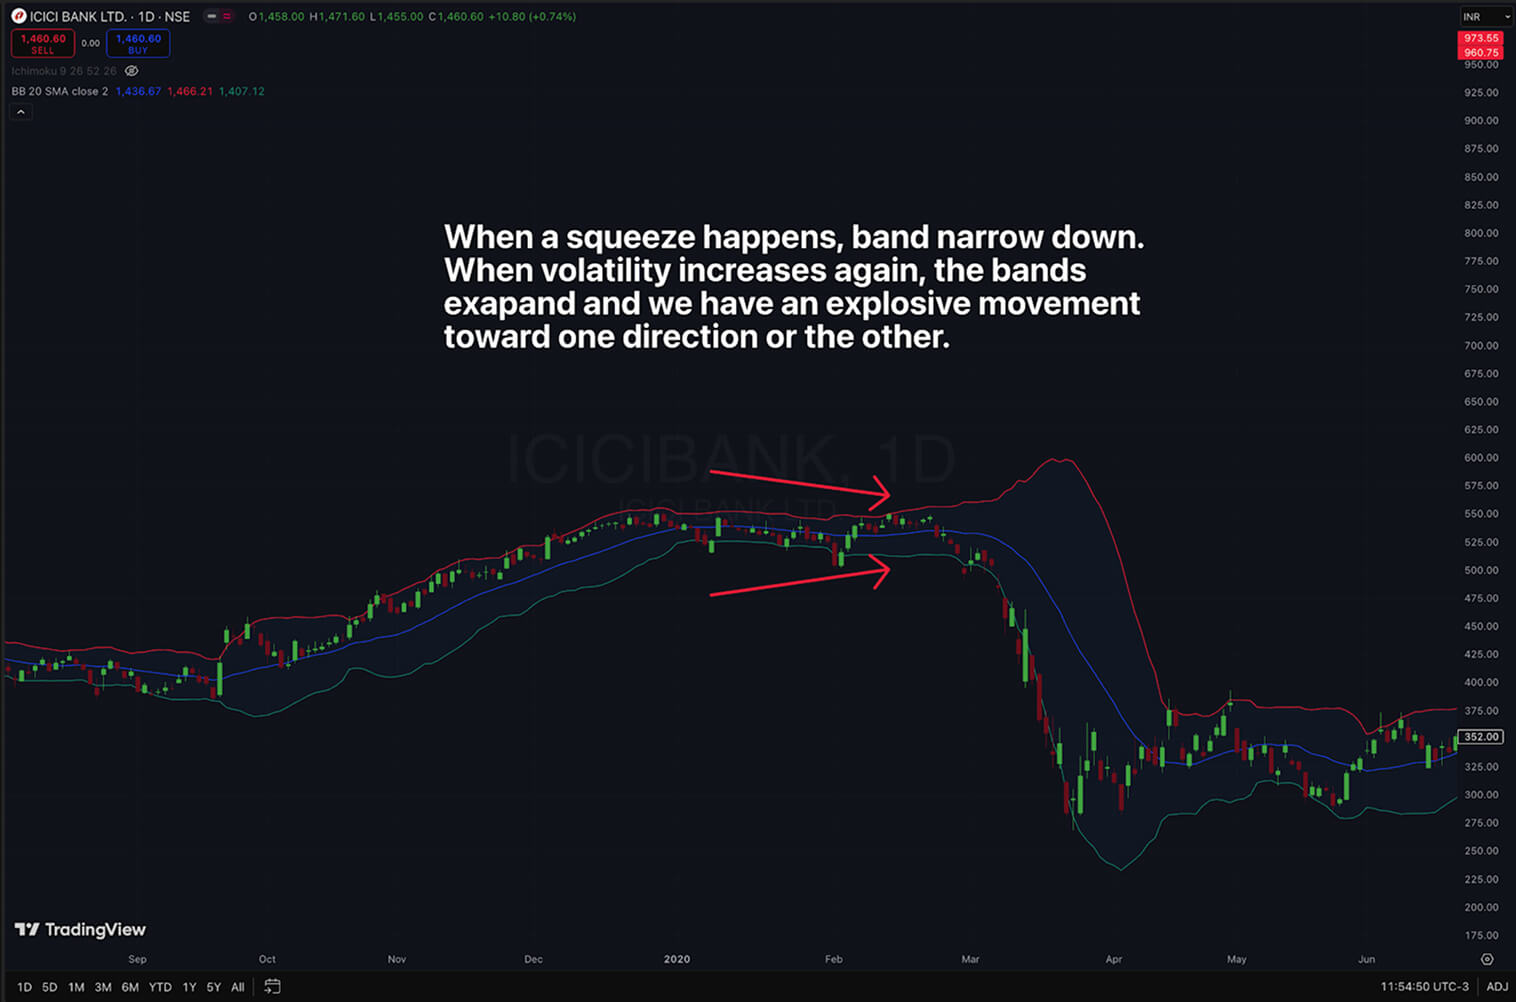
Bollinger Bands, created by John Bollinger, are among the top swing trading indicators used to measure market volatility and identify relative price highs and lows. They consist of three lines plotted on a price chart: a middle band, which is typically a 20-period simple moving average; an upper band (middle band plus two standard deviations); and a lower band (middle band minus two standard deviations). These bands expand or contract according to market volatility, visually indicating when price is unusually high or low relative to its recent average and helping traders spot eventual reversals or breakout opportunities.
Formula:
The default setting for Bollinger Bands is (20, 2):
- Middle Band: 20-period SMA
- Upper Band: 20-day SMA + (2 * 20-day standard deviation)
- Lower Band: 20-day SMA – (2 * 20-day standard deviation)
Swing traders can use Bollinger Bands to evaluate price extremes, trends, and volatility. When price touches the upper band, it may indicate overbought conditions, while touching the lower band suggests oversold. In strong trends, price can ride along a band, indicating strong momentum rather than a reversal. A “squeeze,” where bands narrow tight, indicates low volatility and often triggers explosive breakouts, being one of the most common strategies employed by swing traders.
Bollinger Bands also help with mean reversion strategies, as prices tend to return to the middle band, especially in sideways markets. While the standard 20,2 setting is widely used, these parameters can be adjusted based on the volatility levels of the security, with some exhibiting a more volatile nature than others.
Pros: the Bollinger Bands dynamically adapt to volatility, giving us a clear sense of trend direction, volatility levels, and overbought/oversold conditions. They can be adapted for range trading, while also being useful in trend-following scenarios.
Cons: during a squeeze, it can be challenging to know the direction of the breakout. When a trend is too strong, the price can stick to one band, leading to losses when trying to make mean-reversion trades.
5. Volume and On-Balance Volume
Volume is a crucial indicator for technical analysis since it measures the conviction behind price movements. High volume suggests increased market participation, making the move more robust and trustworthy. Volume indicators like the OBV (on balance volume) can help us identify and understand buying or selling pressure.
Formula:
Here’s how to calculate the OBV:
- If Close_today >Close_yesterday: OBV = OBV_prev + Volume_today
- If Close_today < Close_yesterday: OBV = OBV_prev − Volume_today
Swing traders use trading volume to back up trends, breakouts, and reversal swings. High volume validates the significance of price movements, whereas low volume suggests an increased risk of a false move. Volume at support or resistance levels can also indicate the strength of those levels. The OBV is usually used to identify divergences, indicating accumulation and distribution phases where “quiet buying” or “quiet selling” could be happening.
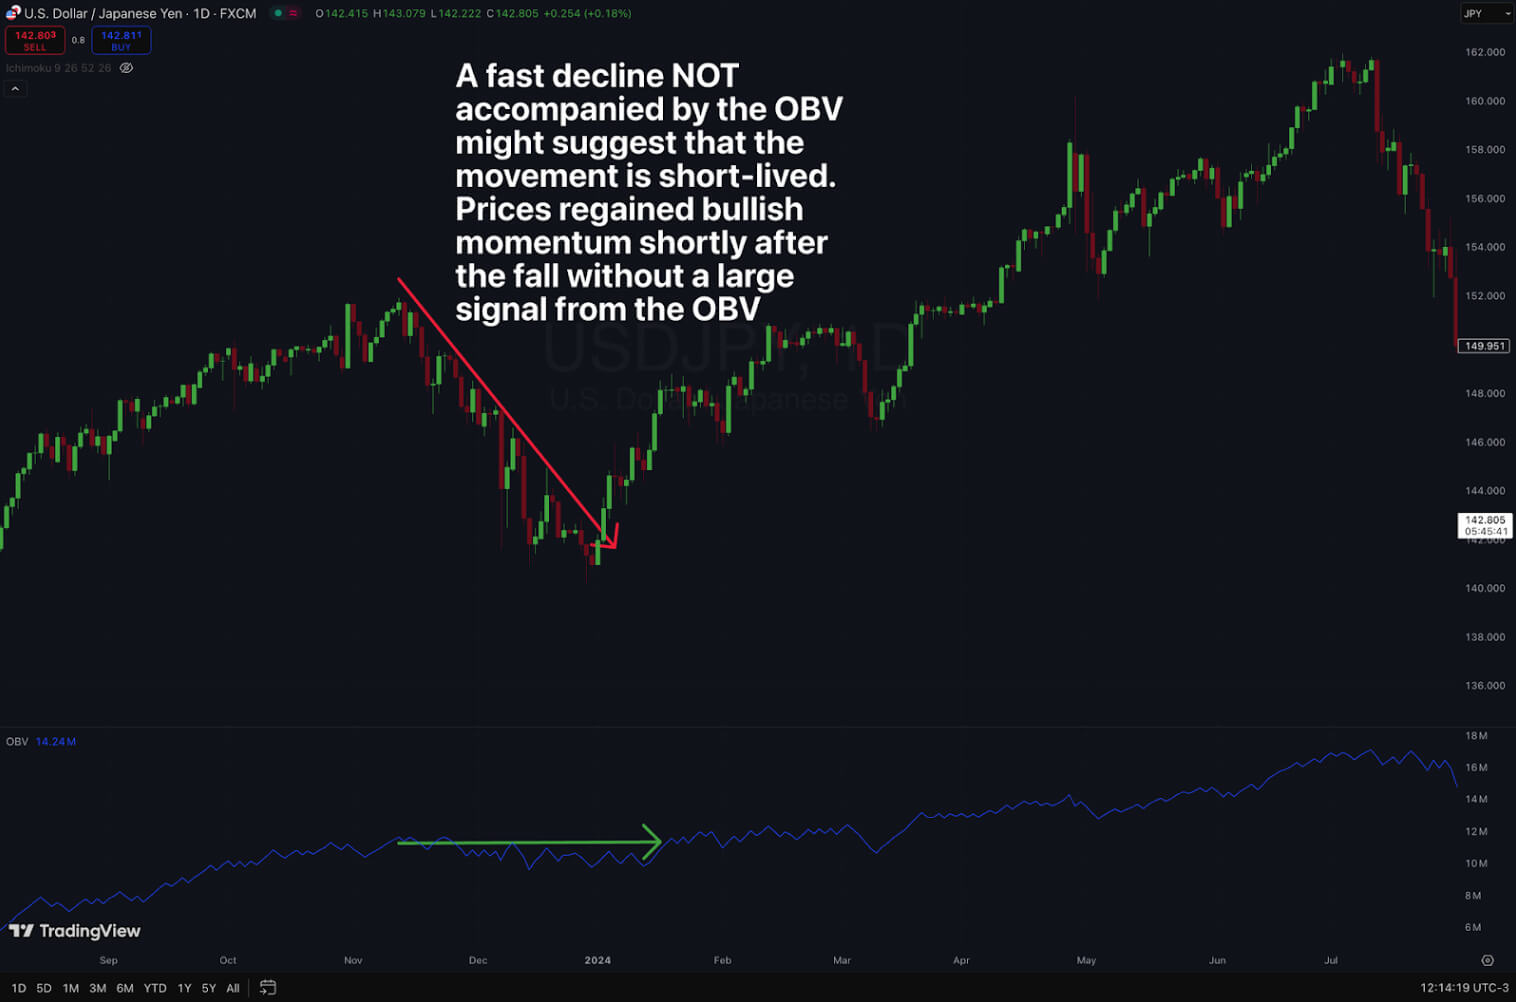
Pros: we can say that volume acts as a “lie detector” for price movements, confirming their intensity and validity. It helps avoid false signals, and for this reason it is incorporated into successful swing trading strategies to reveal market activity not visible in price alone.
Cons: interpreting can be quite complex and requires a deeper understanding of context. Not all volume spikes are extremely revealing; an example would be volume spikes derived from news events. In some markets, especially forex, reliable volume data can be scarce. An excess in reliance on volume can lead to missed opportunities if you’re always waiting for the perfect volume confirmation.
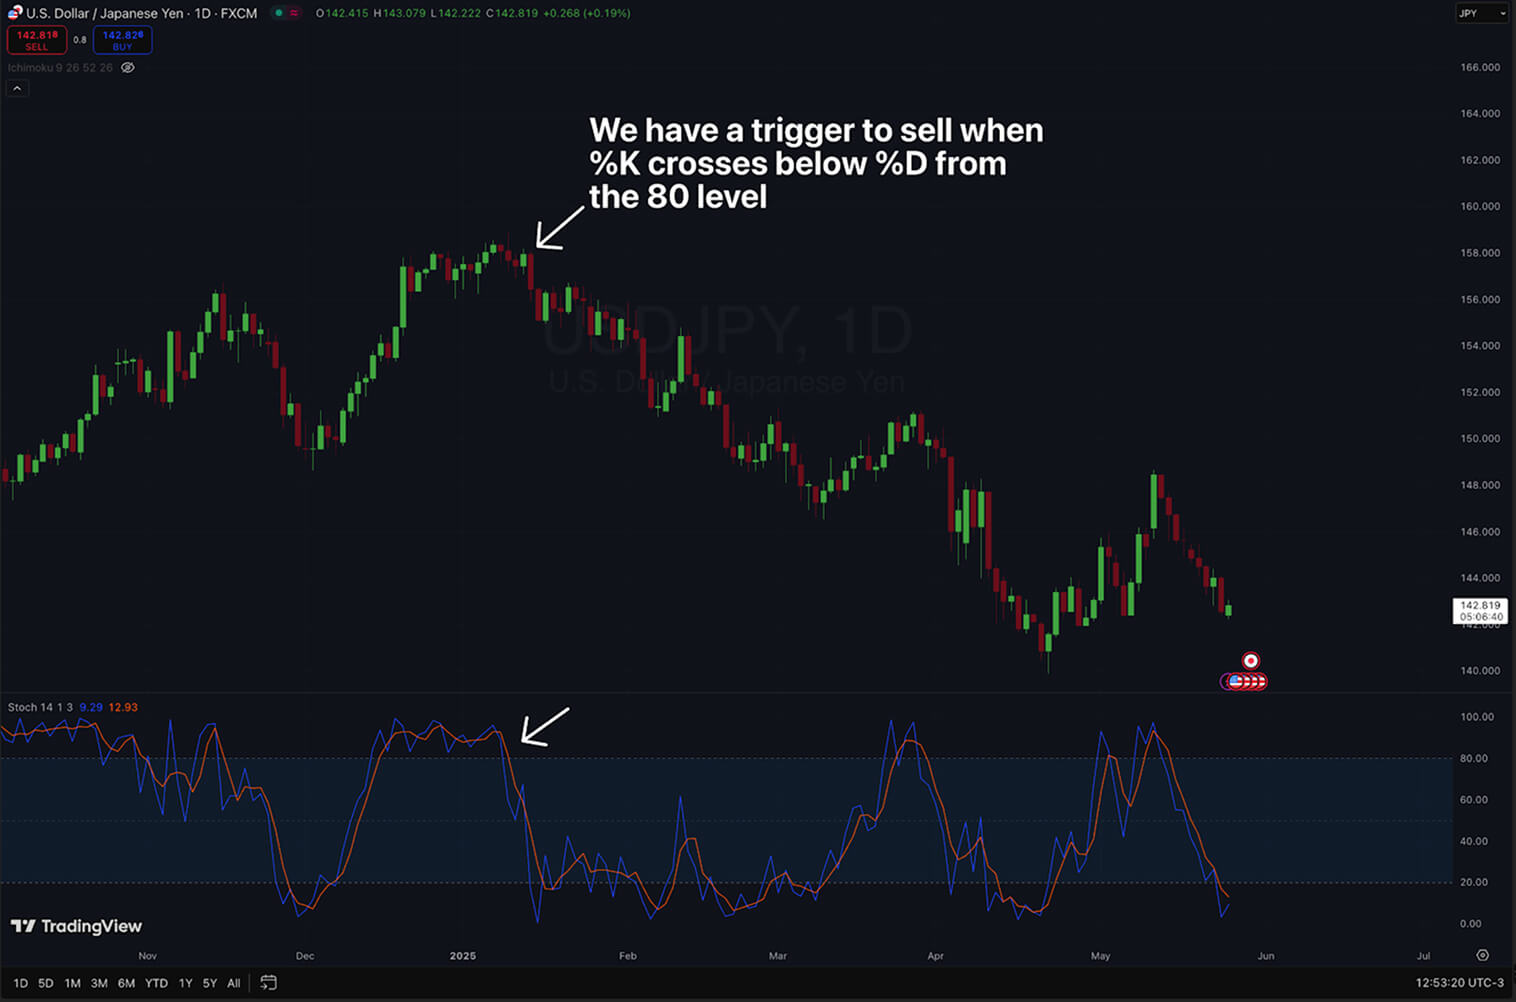
6. Stochastic Oscillator
The Stochastic Oscillator is a momentum indicator that measures the closing price’s position relative to its recent trading range (14 periods by default). It oscillates between 0 and 100, and it’s used to identify overbought and oversold conditions, with values above 80 considered overbought and below 20 oversold. Unlike the RSI, its formula focuses on the relationship between the closing price and the period’s high-low range. It is made up of two lines: the %K line and the %D line, a 3-period simple moving average of %K, acting as a signal line.
Formula:
%K = [(Close – Lowest Low_n ÷ Highest High_n – Lowest Low_n)] * 100% (where n is the periods)
The %D is the 3-period simple moving average of %K.
The Stochastic Oscillator is primarily used for timing entries and exits, especially in sideways markets. When the %K line crosses above the %D line from below the 20 level, it generates a bullish signal. On the other hand, a cross below the %D line from above the 80 level generates a bearish signal. It is also used to identify and measure divergences, indicating the possibility of trend reversals. In trending markets, it can be used to identify pullbacks for buying or selling opportunities.
Pros: it can accurately identify short-term price reversals, providing signals much faster than other indicators, which can be a huge advantage. Its dual-line crossover system and clearly-established overbought and oversold zones make it extremely intuitive and easy to use, especially for beginners.
Cons: it tends to be overly sensitive, much more than the RSI, which can lead to false or premature signals, especially during strong trends, where it might remain under overbought or oversold conditions for a large period. Sudden, sharp price spikes can easily distort the oscillator. Its effectiveness can decrease during strong, directional trends.
7. Support and Resistance Levels
Support and resistance levels are among the most fundamental and basic concepts in technical analysis. These are price zones where historical buying or selling pressure has been strong enough to reverse price movements. Support is a price level where demand concentrates, expected to stop a bearish trend, whereas resistance is where supply concentrates, expected to pause a bullish advance. Markets tend to respect these levels quite frequently.
These levels are not mathematical indicators. Instead, they can be identified through previous highs and lows, trendlines, or moving averages, which act as dynamic support and resistance levels. Fibonacci retracement levels or psychological round numbers can also be seen as relevant points.
Pros: support and resistance are foundational concepts to technical analysis, representing the dynamics between supply and demand. They are extremely important for any trader, regardless of timeframe, and facilitate when thinking about take-profit targets, stop-loss orders, etc. They work best when combined with additional indicators, especially with the RSI or Stochastic Oscillator.
Cons: they can be quite subjective. These levels are also not infallible, and they eventually break. False breakouts are also common, however, trapping traders into bad positions.
Best Swing Trading Indicators: Comparative Table
For a better understanding, here is a comparison table where we summarize each one of the indicators above so you can measure which works best for your trading style and goals.
| Indicator |
Purpose |
Best Use |
Watch Out For |
| Moving Averages |
Highlight trend direction and smooths price action |
Trending markets. You can combine long + short MAs for entries |
Laggy signals and false moves in sideways markets |
| RSI |
Measures momentum and spots overbought/oversold conditions |
Range or mild trends. Good for identifying buy and sell points |
Can stay under extreme conditions during strong trends |
| MACD |
Mixes trend + momentum. Uses line crossovers. |
Trend confirmation and spotting reversals with divergences |
Lags on entries. There are no clear overbought/oversold levels |
| Bollinger Bands |
Shows volatility. Identifies high/low extremes |
Mean reversion trades and spotting breakouts via squeezes |
Prices can stick to the bands during strong trends |
| OBV |
Confirms strength behind price movements. Shows accumulation. |
Spotting hidden reversals or strength behind reversals |
Noisy on low-volume securities. |
| Stochastic Oscillator |
Fast momentum tool. Highlights short-term price reversals |
Quick swing trades in ranges. Good timing at price extremes |
Too sensitive in trending markets |
| Support and Resistance |
Key price zones for bounce or breakout |
Entry and exit levels. Stop-loss and take-profit planning |
Can be subjective and tricky to identify |