Tick Trading - What Is It?


A tick is the smallest possible price movement in a financial market, usually occurring to the right of the decimal point in a price quote. Each market and instrument has a specific tick size that defines the minimum price fluctuation. For example, S&P 500 Index futures and E-mini futures have a tick size of 0.25, while crude oil futures move in ticks of 0.01, and gold futures (GC) in 0.10.
Since the Securities and Exchange Commission (SEC) implemented decimal pricing in 2001, the minimum tick size for stocks above $1 is one cent. In the foreign exchange (Forex) market, the concept of pips is more common, with one pip usually representing a movement of 0.0001 in a currency pair.
The value of a tick varies depending on the contract being traded. For instance, each tick in the S&P 500 E-mini futures is worth $12.50, and for crude oil, a tick is worth $10. This variation makes it essential for traders to know the tick value of the instruments they trade, which can be found on exchanges like the Chicago Mercantile Exchange (CME).
The tick serves as the smallest unit of price change, directly influencing how assets are traded in various markets. It helps maintain market structure by setting limits on price fluctuations. In the stock market, for example, stocks typically trade in one-cent increments, while in the futures market, each asset has its own designated tick size based on the contract. Currency markets use ticks to calculate price changes measured in pips and basis points.
The tick plays a fundamental role in ensuring that price changes occur in manageable steps, which aids liquidity providers in managing their risk and makes it easier for traders to gauge market sentiment.
A tick is the smallest movement in price, while a point refers to a larger unit of movement, which can vary depending on the market. In stock trading, one point is equal to $1.00, whereas in Forex, one point can represent 10 pips or 0.001 in some cases.
For instance:
In trading, the tick size refers to the smallest price increment by which a security or futures contract can move. For example, the E-mini S&P 500 futures contract has a tick size of 0.25, which means that the price can fluctuate in increments of 0.25. The size of a tick is crucial for determining the minimum price change that a security can experience and directly affects the cost of trading and market liquidity.
The tick size is essential in various markets, including stock trading, options trading, and futures trading. In stock trading, the Securities and Exchange Commission (SEC) sets the minimum tick size for stocks, which is usually one cent for stocks priced above $1. In futures trading, market makers and traders rely heavily on tick data to make fast, informed decisions. The tick size in futures and options markets varies depending on the contract; for example, crude oil futures move in ticks of 0.01.
Different tick sizes apply depending on the instrument. For instance, the U.S. stock market typically has smaller tick sizes compared to futures markets, which might have larger ticks, especially for highly liquid assets. Tick sizes for stocks were impacted by the tick size pilot program introduced by the SEC, aimed at analyzing the effects of larger tick sizes on liquidity and market quality.
The tick size plays a significant role in the trading costs and overall execution strategy. Smaller tick sizes allow for finer price adjustments, potentially lowering trading costs by tightening bid-ask spreads. However, smaller tick sizes can lead to more market volatility, as prices move more frequently within narrower ranges. Conversely, larger tick sizes create wider spreads, which can increase the cost of trading but may reduce noise in the market, making it easier for traders to identify significant price movements.
Understanding the value of a single tick is important when you’re trading. For example, in the E-mini S&P 500 futures, one tick is worth $12.50, meaning that every tick movement can significantly affect profit and loss, depending on the contract size.

Tick charts are unique in that they do not measure price over time, but rather over the number of trades executed. This means that one tick is formed every time a trade occurs, regardless of how much time passes. Traders often use tick charts to capture high-frequency trading activity and observe detailed price movements without the constraints of time-based intervals.

Traders use tick data in various strategies, particularly for scalping and short-term trading. Scalpers benefit from tick data by making rapid trades in response to even the smallest price changes, while high-frequency traders (HFTs) rely on tick data to capture quick price movements. Tick charts help them identify patterns, reversals, and micro-trends that time-based charts may miss.
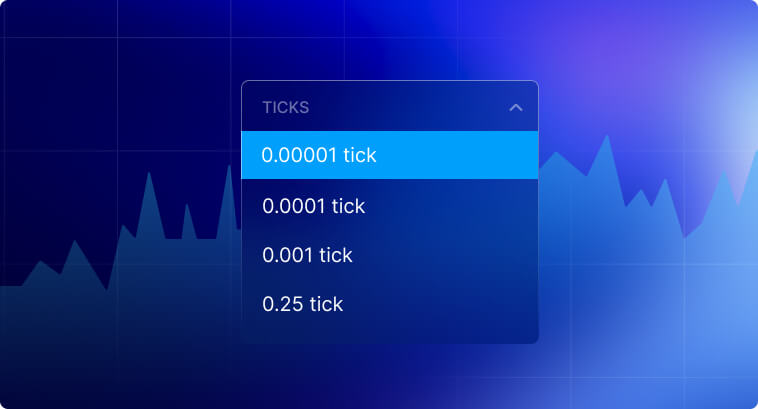
Here are typical tick sizes for different financial instruments:
Changes in tick size can significantly alter how traders approach the market. A smaller tick size might encourage more frequent trading with tighter profit margins, as the smaller increments allow for finer price adjustments. Conversely, larger tick sizes can lead to fewer trades with larger potential profits or losses, as price movement between ticks becomes more pronounced.
In 2016, the SEC conducted a pilot program that increased the tick size for 1,200 small-cap stocks, aiming to assess its impact on liquidity. The results showed that larger tick sizes improved liquidity but also made it more difficult for some traders to execute precise trades, impacting their strategies.
Tick data is critical in high-frequency trading (HFT) and algorithmic trading strategies due to its ability to capture real-time transaction activity and price fluctuations. Unlike time-based data, tick data provides a granular view of every trade, allowing algorithms to detect patterns, execute trades, and react to market changes in milliseconds. This is particularly important in volatile markets where quick decisions can mean the difference between profit and loss.
Many algorithmic trading strategies rely on tick data to optimize trade entries and exits by analyzing price trends at the most detailed level. Algorithms can process thousands of ticks per second, allowing them to identify minute opportunities that human traders might miss.
Tick charts are invaluable for scalpers and short-term traders who need to monitor rapid price changes. By setting the chart to specific tick intervals, such as 100 or 500 trades, traders can visualize market momentum and capture small price movements. Since tick charts are not time-dependent, they reduce noise during periods of low market activity, providing cleaner signals for fast trade execution.
Tick data offers more than just short-term trading benefits; it is also an excellent tool for trend identification and market sentiment analysis. By analyzing tick volume, traders can gauge market interest and momentum. For example, increasing tick volume alongside rising prices may indicate strong buying pressure, whereas decreasing tick volume could signal weakening trends or a potential reversal. Traders can also use tick data to identify support and resistance levels, which are crucial for setting strategic entry and exit points in trades.
Tick charts are often compared to other chart types, such as time-based or Renko charts. While Renko charts focus on price movements in specific increments, tick charts excel at tracking trade activity, offering greater flexibility during both high and low volatility periods. You can learn more about the benefits of tick charts compared to other methods here.
Tick data is also helpful for pre-market and after-hours trading. During these times, traditional time-based charts may show flat lines or large gaps due to lower trading volume, leading to misleading signals. Tick charts, however, capture every transaction, providing more accurate insights into market sentiment. This is especially useful for traders looking to make informed decisions during these quieter periods, as they can see every price movement, regardless of the volume of trades occurring.
To improve your trading results using tick data:
While tick data provides a highly detailed view of market activity, it also has risks. The noise in tick data, especially during periods of high volatility, can lead to overtrading or reacting to false signals. It’s essential to combine tick data with broader market analysis to avoid making impulsive decisions based on micro-movements. Additionally, frequent trading, especially in scalping strategies, can lead to higher transaction costs, which may erode profits over time.
While trading based on tick data can provide more precision, it also carries risks. Relying solely on tick data can lead to overtrading or misinterpretation of market signals, especially in volatile conditions. Tick data can amplify noise in the market, leading to false signals and potentially resulting in losses.
Warning: Trading based on tick data requires a high level of discipline and understanding of market dynamics. It’s essential to avoid reacting impulsively to small price movements without considering the broader context. Additionally, increased transaction costs from frequent trading may erode profits over time.