Top 5 Momentum Indicators to Enhance Your Trading Strategy


To track price changes and detect market trends, traders use charts with various indicators. Oscillators, also known as momentum indicators, are crucial for identifying potential price reversals. They help traders time their entries and exits by highlighting market “overheating,” indicating overbought conditions in an uptrend or oversold conditions in a downtrend. Momentum indicators help traders understand the strength of a price trend and overall market momentum.
When trading with momentum indicators, traders typically look for overbought and oversold boundaries. When the oscillator crosses below the oversold boundary, it suggests a bearish trend is overheating, signaling a potential buying opportunity. Similarly, crossing above the overbought boundary indicates an overheated uptrend and a possible sell point.
In this material, we’ll explore the best momentum indicators and how they can be applied in trading strategies to enhance your trading experience.
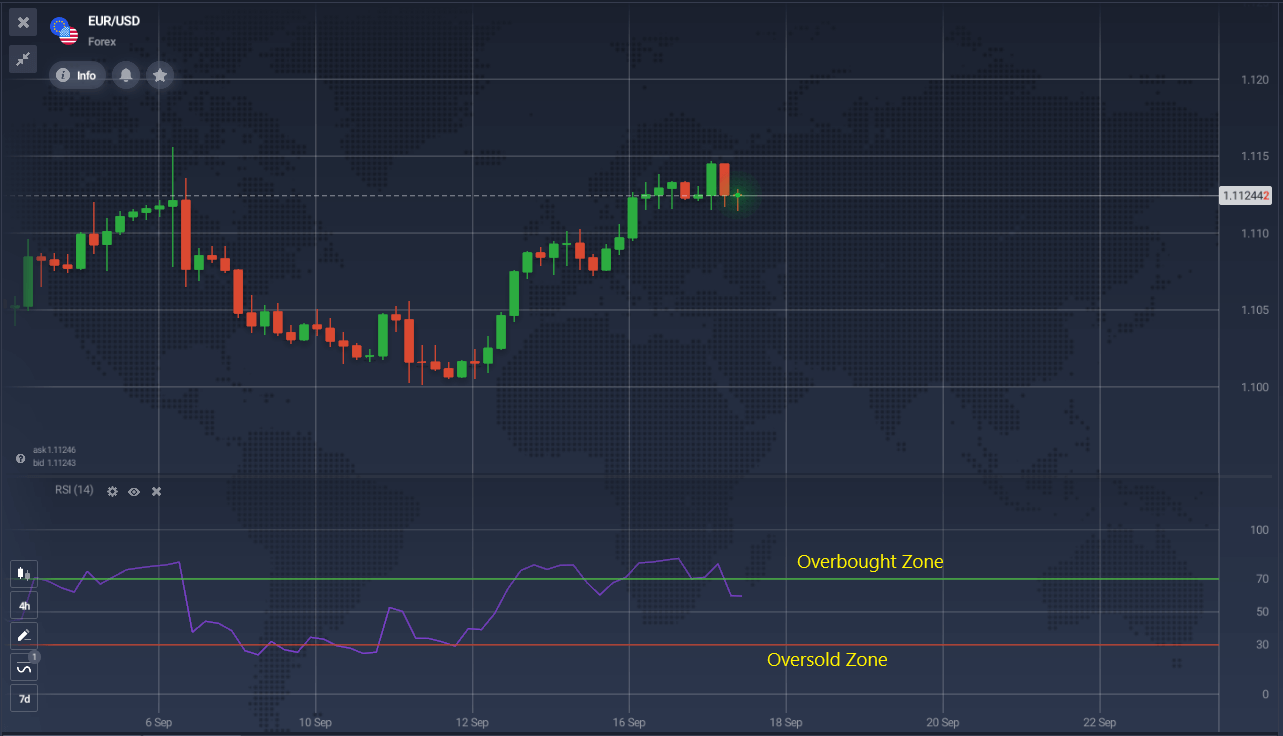
The Relative Strength Index (RSI) is a momentum indicator that measures the ratio of average price gains to average losses over a specified period. It helps in understanding whether buyers or sellers are dominating the market. RSI is commonly used to identify overbought (above 70) and oversold (below 30) conditions, especially on daily charts. This indicator uses 14 periods as the default setting, making it an effective tool for various trading styles. Using indicators like RSI, traders can gauge market momentum and potential reversals.
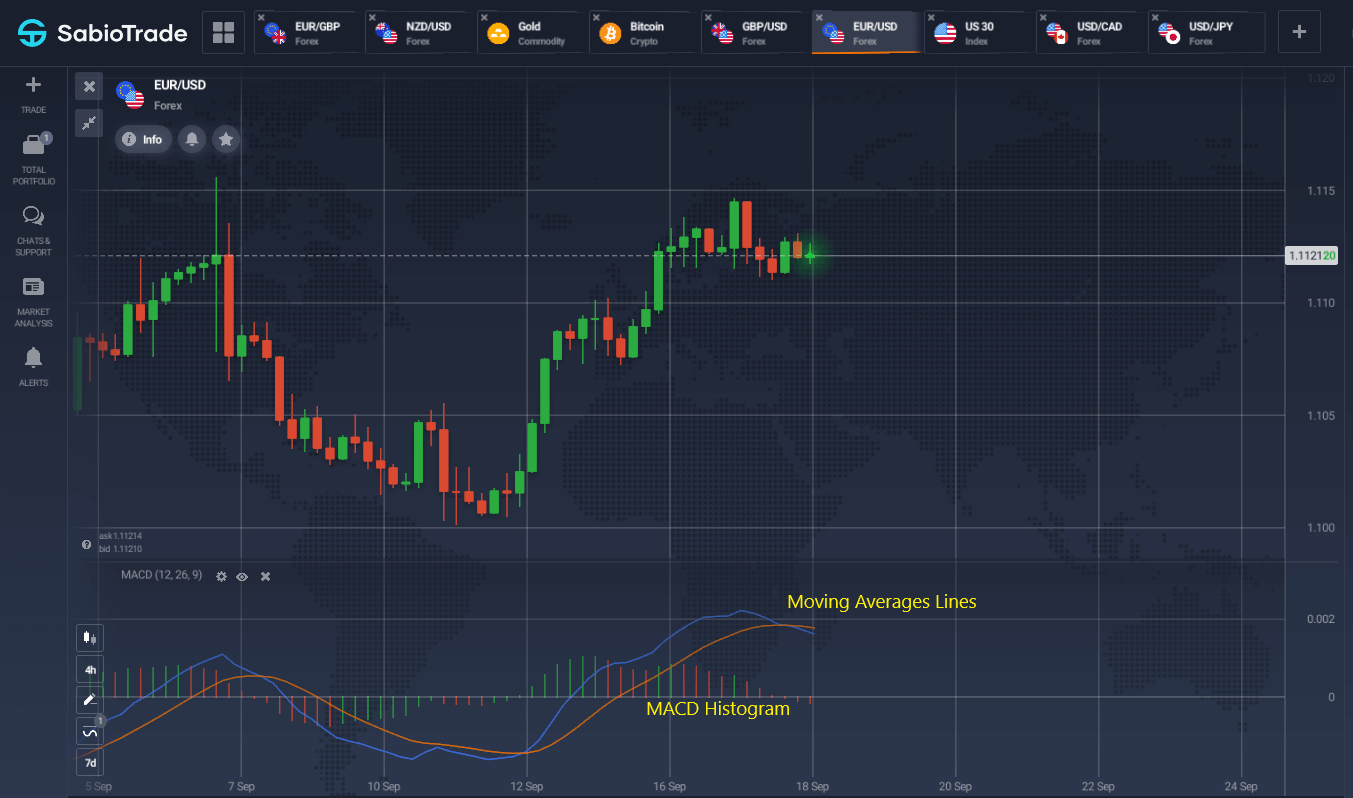
The MACD is a classic momentum indicator that uses moving averages to show both the direction and the strength of a price trend. Developed by Gerald Appel in 1979, it combines the characteristics of trend-following indicators and oscillators. MACD provides clear signals for traders through the crossover of its Signal line and the MACD line. This indicator is versatile and can be adjusted for different timeframes, making it one of the top momentum indicators in technical analysis.
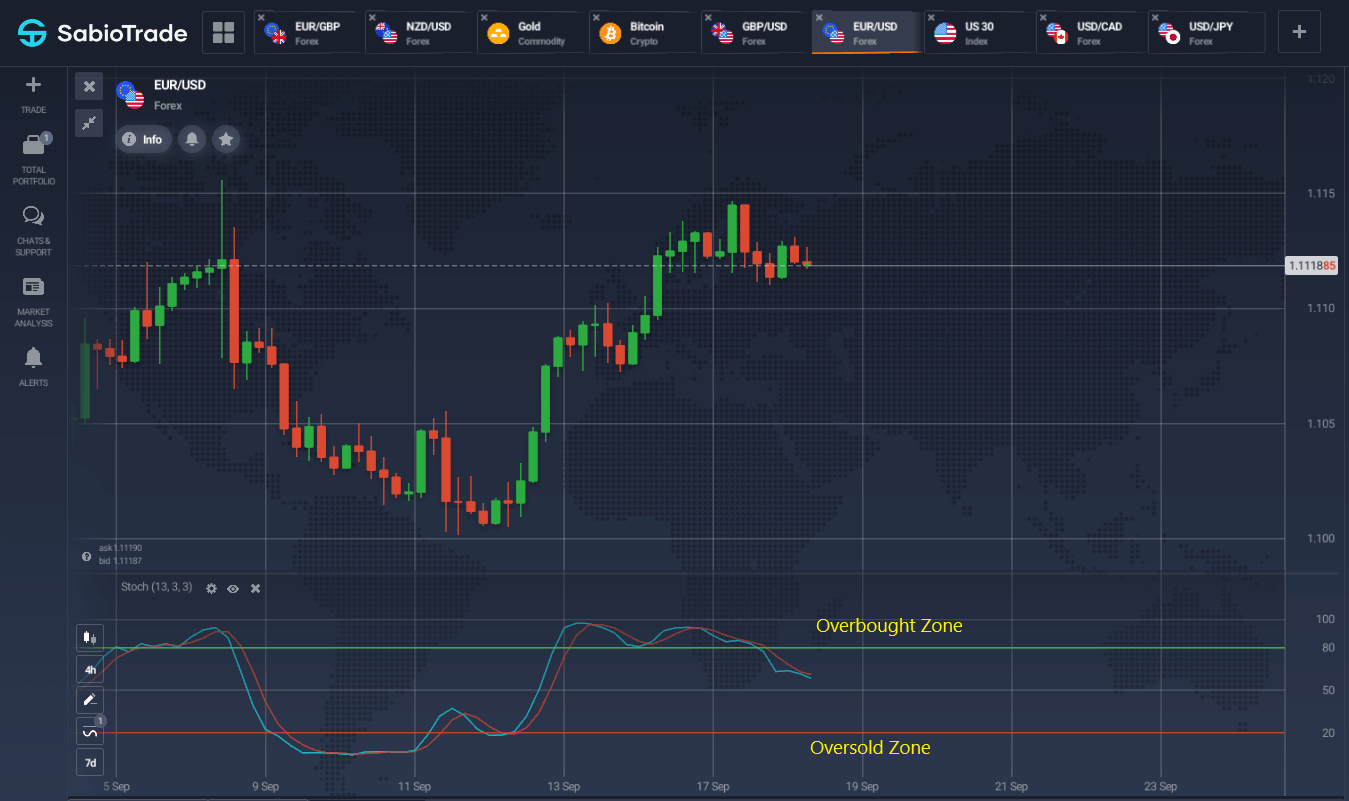
The Stochastic Oscillator measures price momentum by comparing the closing price to its range over a selected period. This momentum indicator is useful for identifying overbought and oversold conditions, with values above 80 indicating overbought and values below 20 indicating oversold. It generates trading signals when the %K line crosses the %D line, making it a valuable tool for both short-term trading opportunities and long-term trend analysis. The Stochastic Oscillator is one of the types of momentum indicators that can help traders pinpoint market tops and bottoms.
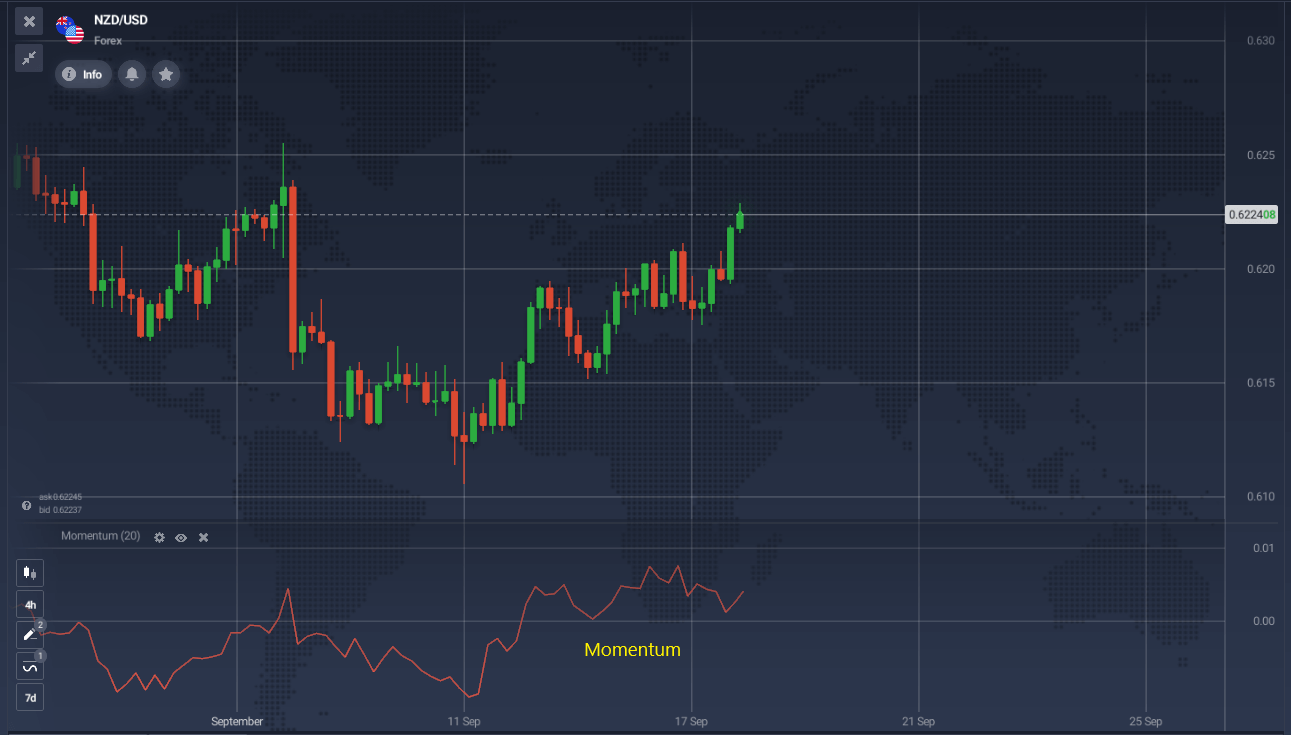
Among the different momentum indicators, the Momentum Indicator is one of the simplest. It shows the rate of change in price, helping traders determine if the market is in an uptrend or downtrend. By comparing the current price to the price from a previous period, it provides a quick snapshot of market sentiment. If current prices are higher than past prices, it indicates an uptrend, and if they are lower, it signals a downtrend. This indicator can greatly enhance your trading by offering straightforward insights into market momentum.
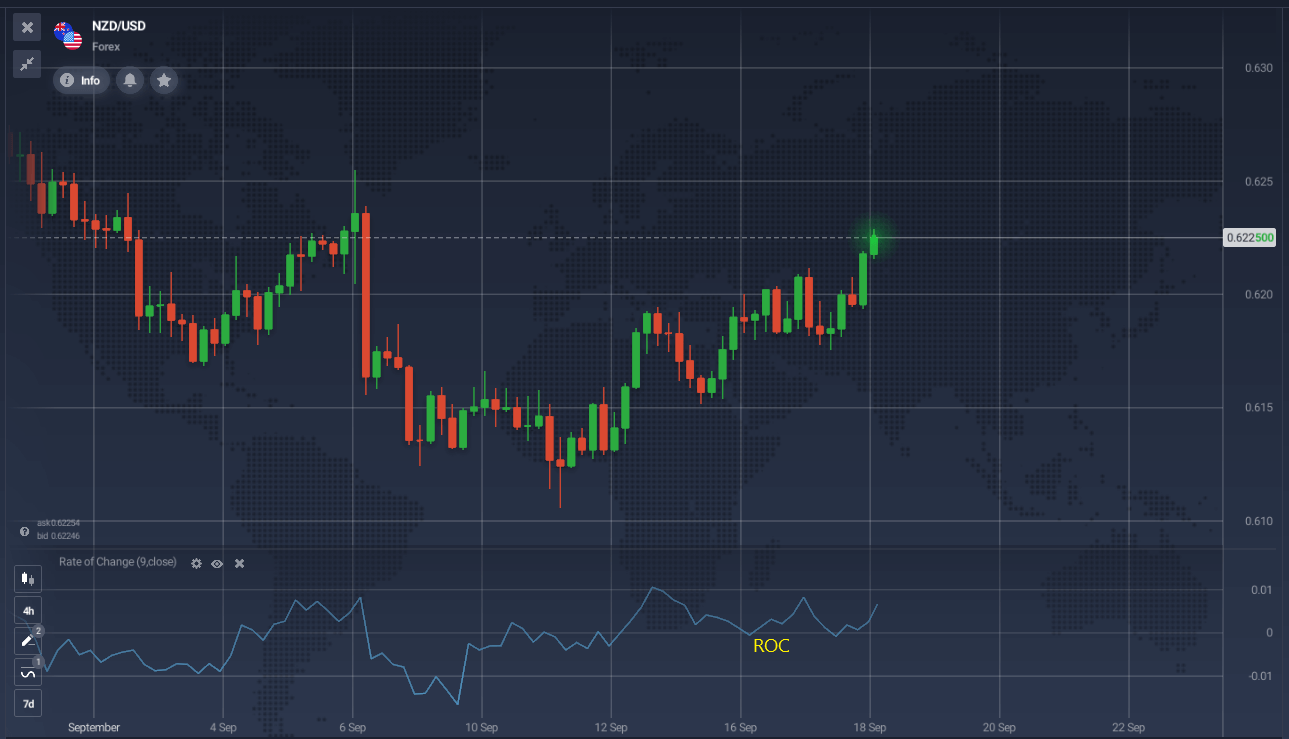
The ROC indicator measures the percentage change in the price of a financial asset between two periods, helping to confirm price momentum or detect divergences. It’s applicable on any timeframe and can help identify overbought and oversold conditions. By monitoring extreme values, traders can spot potential trend changes or consolidations. ROC is one of the momentum indicators to analyze both short-term and long-term trends, providing early warnings of trading opportunities.

The main idea of this momentum strategy using the RSI indicator is to sell when it exits the overbought zone and buy when it leaves the oversold area. Momentum indicators like RSI are also used to watch for divergences between price movements and the indicator. A divergence happens when the price makes higher highs while the RSI makes lower highs, suggesting a possible trend reversal. This implies that the trend’s strength of a price trend might be weakening, potentially due to a lack of sellers rather than an influx of buyers.
In such situations, traders might avoid initiating new long positions, look for opportunities to close existing long positions, and consider short-selling. RSI is straightforward to use, with the primary parameter being the number of periods, usually defaulting to 14. By identifying overbought and oversold zones and divergences, RSI provides valuable insights into market momentum, helping traders make more informed decisions and enhance their trading strategies.
Many traders also consider the concept of the midpoint (level 50) in their analysis. If the RSI curve is above this level, it indicates that buyers dominate the market, suggesting an uptrend in the market. If it’s below, sellers are in control, pointing towards downtrend momentum. When the indicator hovers near the “equator,” it suggests that the price is moving in a sideways range, indicating a flat market. This indicator can greatly assist in understanding whether the market is consolidating or preparing for a move.
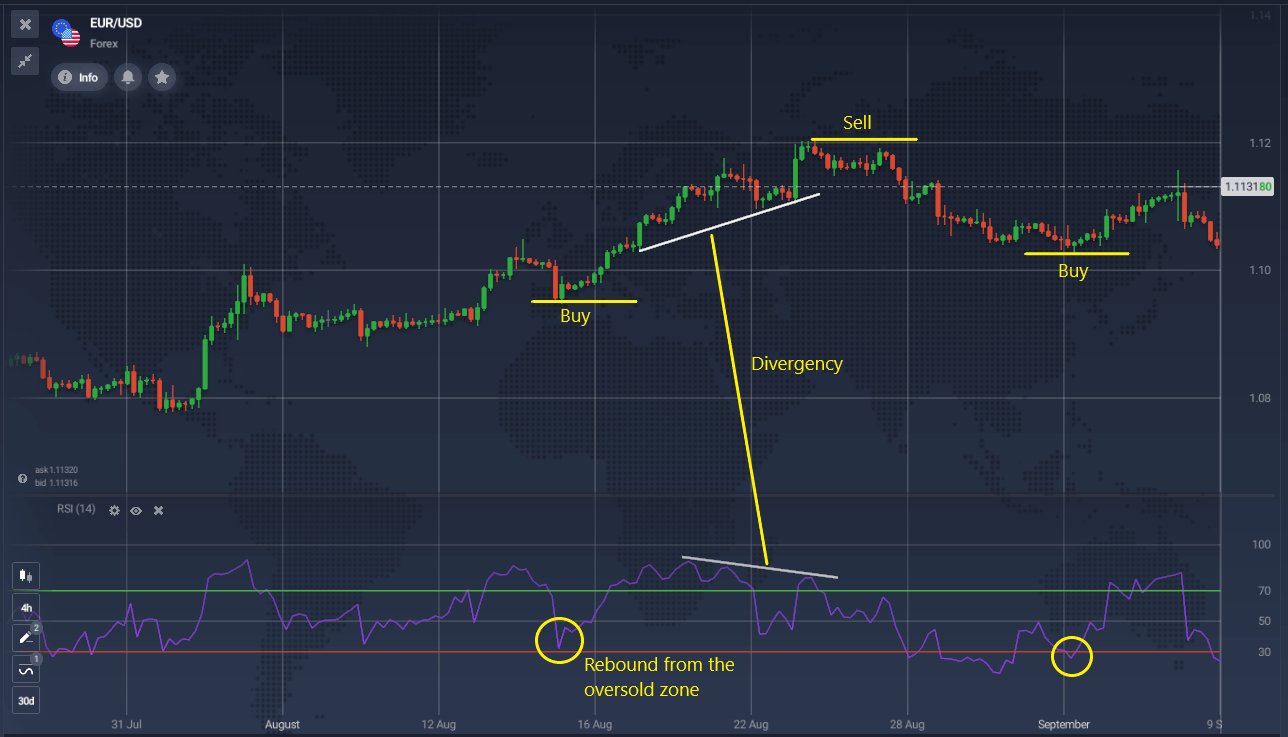
On the EUR/USD chart, we can see entry points for both buy and sell trades. The RSI’s bounce from the oversold zone provided a buy signal. A divergence formed between the price chart and the indicator, indicating a potential trend reversal, which then occurred, providing a sell signal. The third buy trade was similar to the first. Entry and exit signals should be monitored according to your trading strategy and risk management.
The primary purpose of the MACD indicator is to simplify signals from moving averages, reduce lag, and address some limitations of standard trend indicators. It’s a momentum indicator that uses the crossover of the MACD line and the Signal line to generate signals. A crossover from below is a buy signal, while from above indicates a sell. The histogram shows bars crossing the zero line.
A common signal is divergence, similar to the Relative Strength Index (RSI). Divergence between price and the MACD line indicates weakening market momentum and potential reversal. As one of the top momentum indicators, MACD helps traders understand the strength of price movements and enhance trading strategies by providing insights into market momentum and direction.
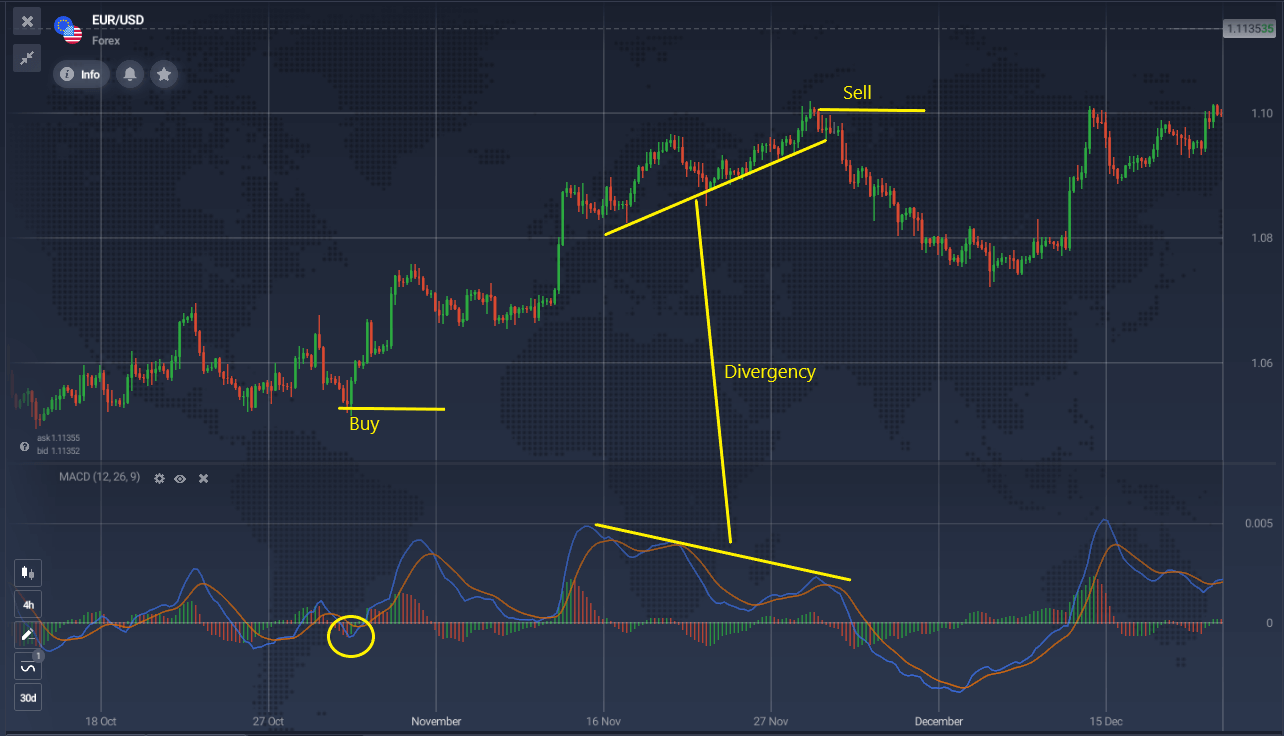
On the EUR/USD chart, a buy signal was triggered by the crossing of the signal lines. The divergence that followed suggested a potential trend reversal, which then led to selling conditions. It is important to note that this divergence acts as an additional confirmation to the crossing of the lines.

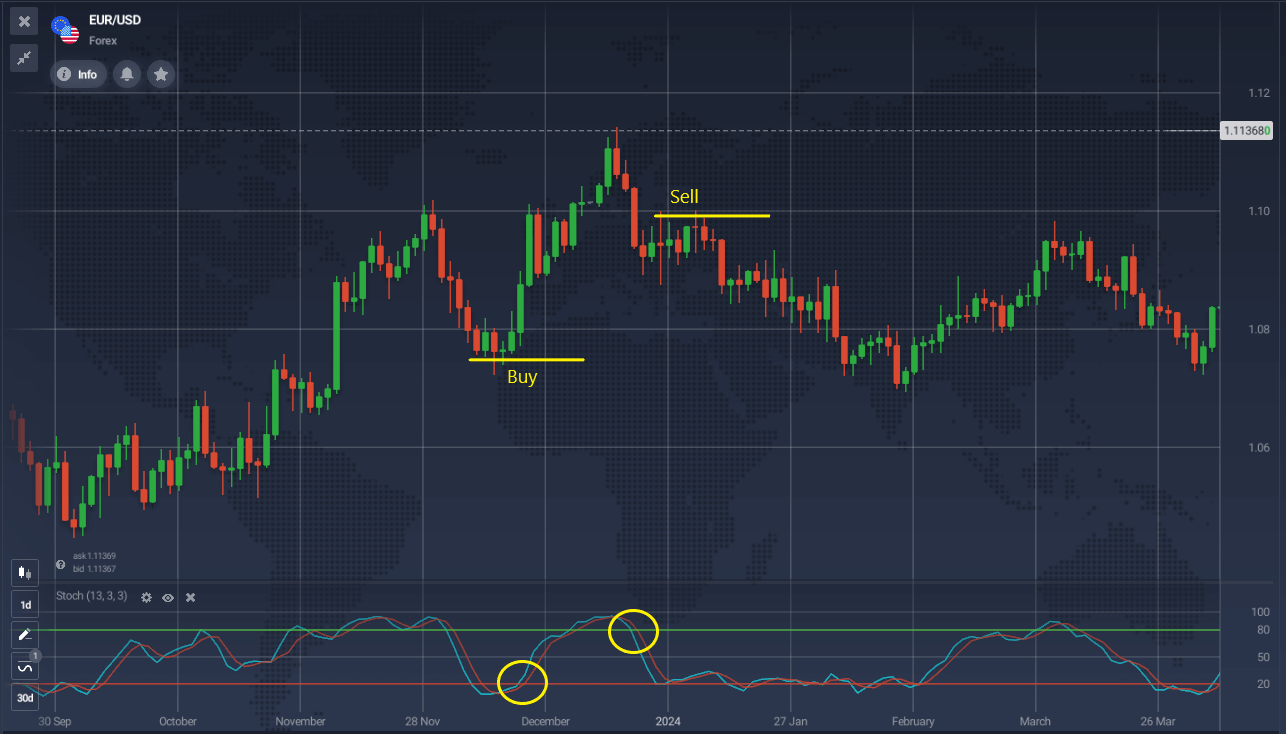
On the daily EUR/USD chart, the conditions for buying and selling are clearly met. The lines cross in zones below 20 and above 80, respectively.
Using a momentum indicator like the Momentum indicator is straightforward in interpretation, as it’s one of the simplest of its kind. It compares the current price to a price from a previous period to identify if a trend is accelerating, decelerating, or maintaining its pace. This indicator measures the strength of a price trend by signaling growing market optimism when reaching a new high, suggesting the uptrend in the market may continue. Conversely, when it reaches a new low, it signals increasing pessimism and potential downtrend momentum.
When prices rise but Momentum falls, it indicates a peak, suggesting it’s time to secure profits and tighten stop-losses. Similarly, if prices make a new high but Momentum peaks lower, it signals a bearish divergence and a strong sell opportunity. The Momentum indicator is a momentum indicator that helps traders make more informed decisions about entry and exit points in their trading strategies.
Example:
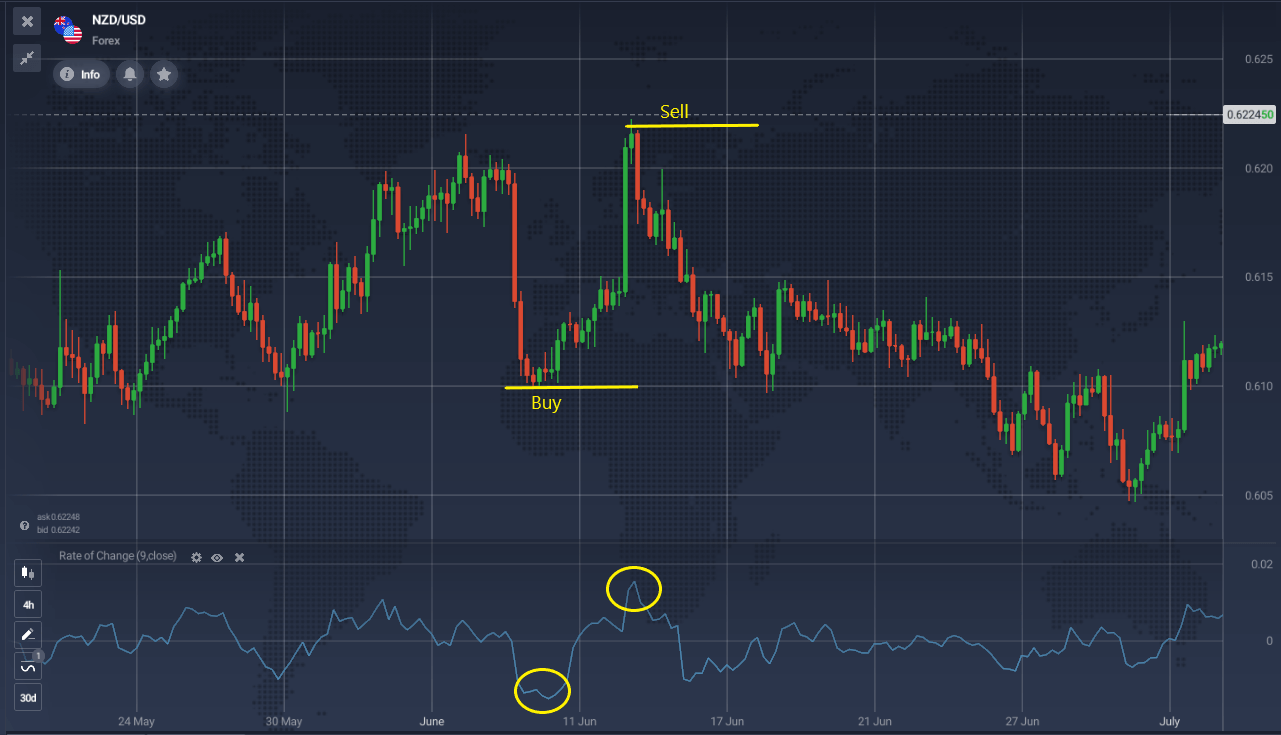
A sell signal occurs when Momentum or its moving average rises significantly, reverses, and begins to decline. Conversely, a buy signal appears when Momentum or its moving average falls significantly, reverses, and starts to rise.

Example
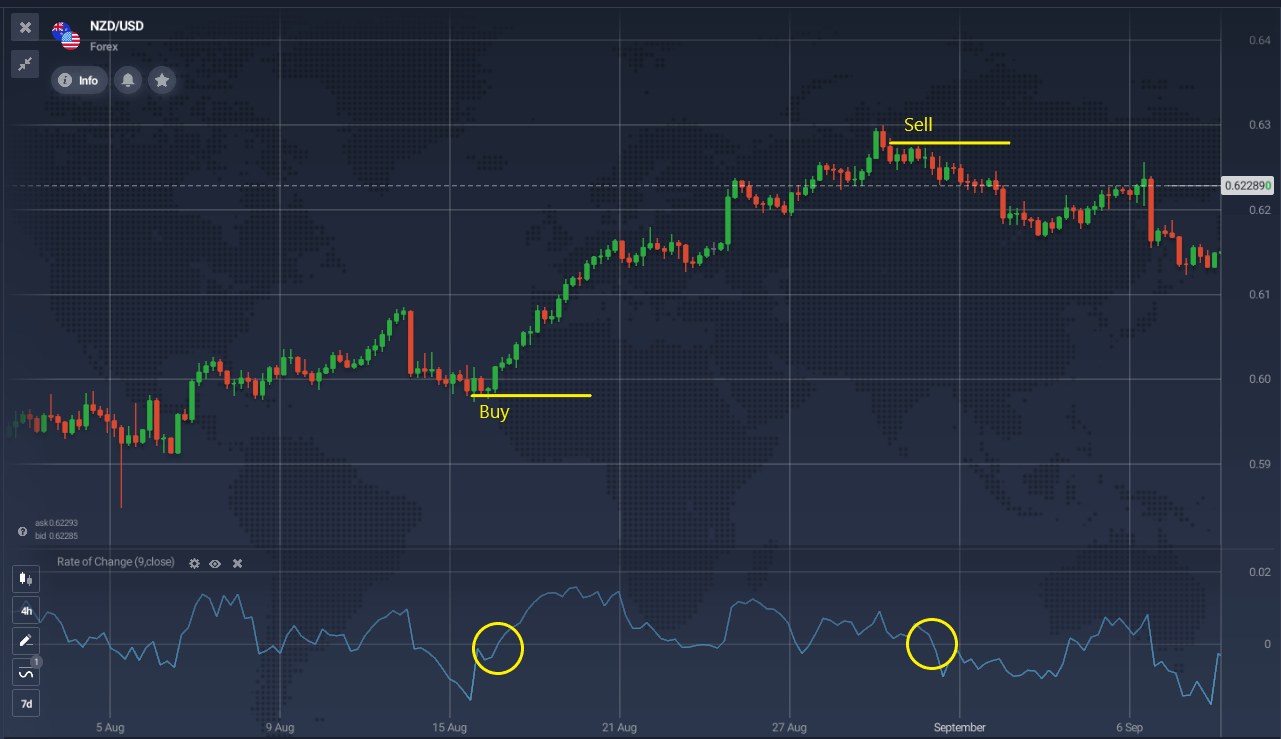
The oscillator’s signals provide various insights into the current trend’s status:
With so many technical indicators available, choosing the right one for your trading strategy can be daunting. How do you know which indicators are suitable for you? And why is it important to use them at all?
These questions have puzzled traders for years. When selecting an indicator, it’s crucial to consider those that have proven valuable to you or experts you trust. Popular indicators are well-documented, but understanding their construction and purpose is key. Many traders don’t take the time to understand how indicators are built or why they should be used.
Profitable traders often study the mathematical construction of technical indicators to fully understand what each one shows. They could even build them manually if necessary, which helps them interpret and apply indicators effectively. Some traders create their own simple indicators to aid decision-making.
Over time, you’ll determine which indicators you prefer and how to integrate them into your trading strategy. While there’s a temptation to create a complex strategy using many indicators, many traders find it more effective to simplify their approach. Striking a balance between accurate analysis and efficient time management is essential to maximizing long-term profit potential.