Aroon Indicator: Boost Your Trading Strategies With This Oscillator

Aroon, one of the most famous oscillators used nowadays, is a technical indicator that measures trend strength and was developed by Tushar Chande in 1995.
Chande—the mind behind several other technical indicators that are still used to this day—is a technical analyst who believes that capturing the early signs of a trend’s development is extremely important. This indicator’s name comes from the word Aruna, meaning “dawn” in the Sanskrit language. This emphasizes the fact that being early is a key motivation for creating and using the indicator.
The Aroon Indicator’s main features are the Aroon Up and Aroon Down. This indicator is based on the idea that bullish trends will keep reaching higher highs, whereas bearish trends will keep making lower lows. For this reason, both lines representing Aroon Up and Aroon Down measure the peaks and dips of the previous 25 periods, which is defined by default on most trading platforms.
Interpreting the Aroon indicator is pretty simple: We go long—or buy—when the Aroon Up crosses above the level of the Aroon Down and we go short—or sell—whenever the opposite crossover happens.
Calculating the Aroon Indicator is very simple and easy:
Both of these formulas will result in values that range between 0 and 100 for the Aroon-up and Aroon-down lines. Values closer to 100 tell us we have a strong trend. We have an example down below on how to read the indicator.
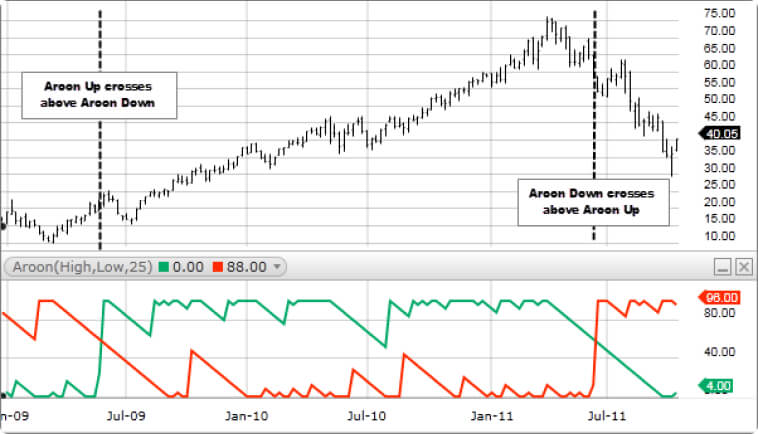
You can use the Aroon Indicator by watching how both lines interact with each other, as line crossovers tend to be what helps traders find buy or sell signs. The green line represents the Aroon Up indicator, whereas the red line is Aroon Down. Whenever the green line crosses above the Aroon-Down red line we might have a buy signal, indicating the start of an uptrend. Whenever the red line crosses above the Aroond-Up green line we might have a sell signal, indicating a trend reversal. You can see at the last data point on the chart above that the Aroon Down is at 96.00, suggesting that the downtrend is now much stronger than any possible uptrend represented by the Aroon-Up line at 4.00.
Usually,25 is the standard number of periods used to compute the values for the Aroon indicator. That tends to be highly effective in measuring medium-term trends and smoothing out any noise found in shorter timeframes. You can surely try different periods to better adjust this momentum indicator the way you see fit. Highly volatile assets tend to benefit from shorter periods, for example.
As you have seen above, the most basic way to interpret this indicator is by looking for crossover signals. You can easily use the Aroon oscillator to identify potential trend reversals. Most traders tend to buy when the Aroon-Up indicator crosses above the Aroon-Down indicator and sell when the crossover happens the other way around.
Another strategy among popular Aroon indicator strategies involves looking for divergences between what the indicator says and what the price says, which is a pretty common use case for momentum oscillators like this one. If prices are making higher highs but the Aroon-Up line is not reaching its previous peaks, then there is a strong reason to believe that buyers are losing momentum and we might be approaching a trend reversal.
Most advanced traders are familiar with the flaws of technical analysis tools. They already know that these indicators can give us false signals pretty often. If you’re dependent on one indicator alone to read price action, you might end up overtrading and investing in ineffective strategies.
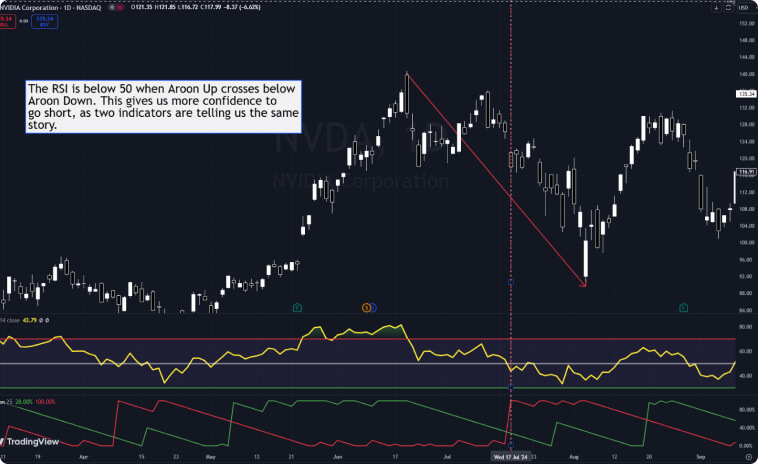
The Aroon indicator is at its best when combined with other tools like the RSI, which is an indicator in technical analysis used to identify overbought and oversold levels. Similarly to the Aroon Indicator lines, RSI values range from 0 to 100. Traders often use this indicator to find opportunities related to trend reversals, especially when it reaches key levels above 70 or below 30. Using this indicator with the Aroon lines can help confirm if a new trend is supported by momentum or not, as well as improve divergence analysis. The main examples of how to combine both these indicators include:
In the image below, you can see an example of how combining the Aroon Indicator with the RSI can lead to more confident decision-making.
You can also use Aroon along with moving averages—exponential or simple, depending on your preference—to better understand the overall context of the trend. Take as an example: if the Aroon-Up line crosses above the level of the Aroon-Down line and prices are trending higher than a 20-day moving average, we have reasons to believe in the potential for an uptrend in the short term. But if the Aroon-Up line crosses above the Aroon-Down line while prices are below a relevant moving average—such as 20, 50, or 200—this is an indication of a possible pullback, but the overall trend is still bearish.
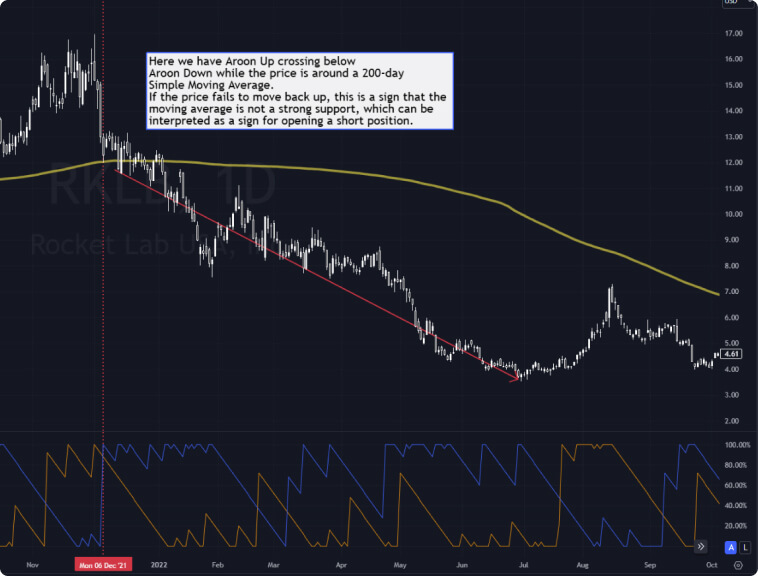
Consider that the Aroon-Up line is orange and the Aroon-Down line is blue in the image above.
Not only the Aroon Indicator is a powerful tool, but it also has enough flexibility to be applied across different market conditions and timeframes. You can easily adjust the Aroon period according to the timeframe—intraday to weekly—as well as according to the levels of volatility of each asset. When trading cryptocurrencies or other assets that are known for their increased volatility, a 14-day period can be more responsive to changes in the price of an asset than a 25-day period.
The Aroon Indicator is typically present on every trading platform nowadays. To use it for better-identifying trade signals, you can go to your preferred platform—MetaTrader 4, TradingView, or any other you like—and search for “Aroon” in the indicators menu.
Since I use TradingView, I can give you the step by step down below:
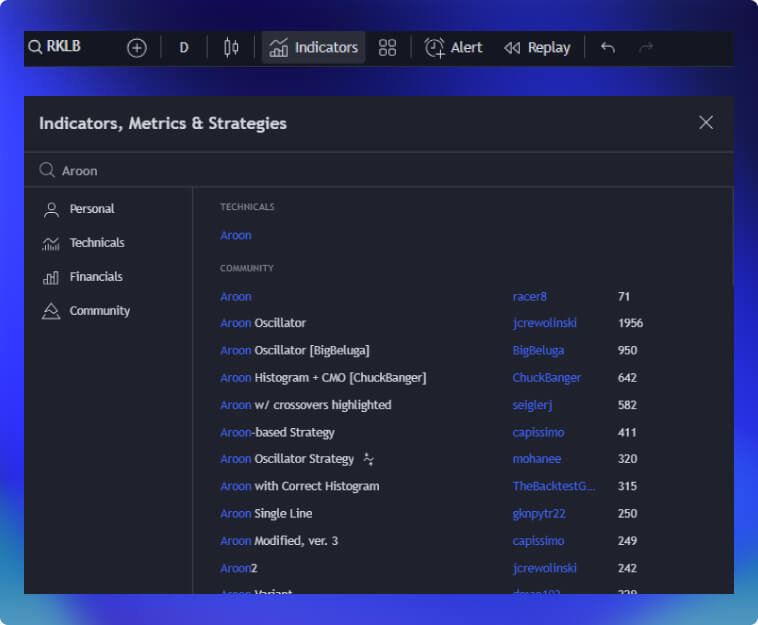
As soon as you have the Aroon chart open in your trading platform, you can observe how the indicator lines behaved throughout past events. Look at past Aroon crossovers to measure how accurately they predicted price movements and test different periods to see how different are the signals that the indicator shows. This can help you find the most optimal settings that have been historically more effective in capturing trends, especially before large movements.
Several tools in technical analysis are used to identify trends, their strength, and price divergence. Don’t be afraid to explore the Aroon Indicator with other tools, as well as different versions of Aroon with other periods.
Relying solely on a single indicator is a recipe for losing money and falling into bull or bear traps due to false signals. Using moving averages, RSI, and other tools combined with the Aroon Indicator will offer the best experience and more reliable signs.
The Aroon Indicator provides valuable insights about the trend and how strong it is. This can be a great tool to add to your trading system. However, understanding how the indicator works in depth is essential to get the best of it.
Study the market you’re trading. If you’re trading highly volatile assets, you must use a shorter period instead of 25 to get the best results when you see crossovers happen in the Aroon chart. In less volatile markets, you can smooth out all the noise by using a longer period. Different assets have different tendencies for trends and ranges, so be sure to backtest different Aroon parameters for each asset you’re trading. This will help you find the most optimal settings for each market and improve the effectiveness of introducing the Aroon Indicator into your trading system.
To get the best Aroon signals, you must apply the following guidelines:
The Aroon Indicator is a technical tool that identifies trends, and how strong they are, and it is effective in providing you precise entry points early into the trend. Being early is important because it allows you to ride the trend in full and get the best of it. However, if you’re familiar with the fundamentals of technical analysis, you know that no indicator identifies every single trend and entry point accurately 100% of the time.
Like many other tools in technical analysis, the Aroon Indicator may give us false signals, especially when prices are within a range and not going anywhere. To implement this indicator successfully, you must combine it with other technical tools. Always backtest any new tool you bring into your trading system before applying it in live markets. Learn its nuances and adjust its parameters not only for your trading style but also for the assets you’re trading. Prices move differently across cryptocurrencies and blue chip stocks. Be sure to consider that whenever applying a new technique to your trading style.