What are the “Double Top” and “Double Bottom” Patterns and How Do They Work?
For technical analysts, there’s no need to reinvent the wheel. Modern prices change based on principles that have been around for a long time. That’s why the “Double Top” and “Double Bottom” patterns should be known by every trader.
Both the “Double Top” and the “Double Bottom” can accurately signal a market reversal, which is why they remain popular across all markets.
Let’s start by noting that the “Double Bottom” pattern (W-shape) is a bullish reversal pattern on candlestick charts, although it can also appear on bar and line charts. It is also considered the mirror image of the “Double Top” pattern (M-shape), which is a bearish reversal pattern.
Of course, these patterns are often tied to trader psychology and are best suited for medium- and long-term market analysis. The best part is that they work exceptionally well across all currency pairs and cryptocurrencies.
But how can you use them in trading? Do they apply differently on other markets besides traditional stock trading? Let’s break it down.
What is the “Double Bottom” Pattern?
The “Double Bottom” pattern forms when two price bottoms are roughly at the same level, with a peak acting as resistance. This pattern appears at the end of a downtrend and signals a potential reversal.
Traders typically wait for the price to break the “neckline” to open a long position. However, you should only enter a position if you’re confident, as there is a risk of trading against the trend.
The main principle of the “Double Bottom” pattern is that the greater the distance between the two bottoms, the higher the likelihood of the pattern’s success. This has made the pattern more suitable for long-term trades, as it usually forms over an extended period.
However, there are mistakes to avoid in order to increase the accuracy of your analysis. When used correctly, the “Double Bottom” pattern can yield impressive results. But what makes this pattern work and how can you spot it?
How to Recognize the “Double Bottom” Pattern?
Recognizing the Double Bottom is not difficult once you understand the basics. It’s one of those patterns that appears regularly, and you’ll easily spot it once you notice it. The pattern consists of three main components:
- First Bottom – the price bounces for the first time.
- Second Bottom – the price bounces again.
- Neckline – the temporary resistance formed between the bottoms.
Here’s the market psychology behind this formation:
- First Bottom: During the first bottom, the market pulls back and creates a minimum swing. You might think this is just a normal correction in the downtrend.
- Neckline: During the correction, the price reaches resistance and then pulls back, testing support again. This temporary resistance is called the neckline.
- Second Bottom: Bears want to see if the first bottom provides enough support. If the price breaks below the first bottom, the pattern fails. However, if the second attempt doesn’t fail near the support formed by the first bottom, we’ll see the W-shape on the chart. But it’s still too early to enter the market.
- Breakout of the Neckline: Once the market rejects the second bottom, the price bounces back. If it manages to break above the neckline, cryptocurrency traders will be interested in opening long positions, as this indicates that the bulls are taking control.
And that’s it! The “Double Bottom” figure is simple and straightforward. Here’s what it looks like on the chart:
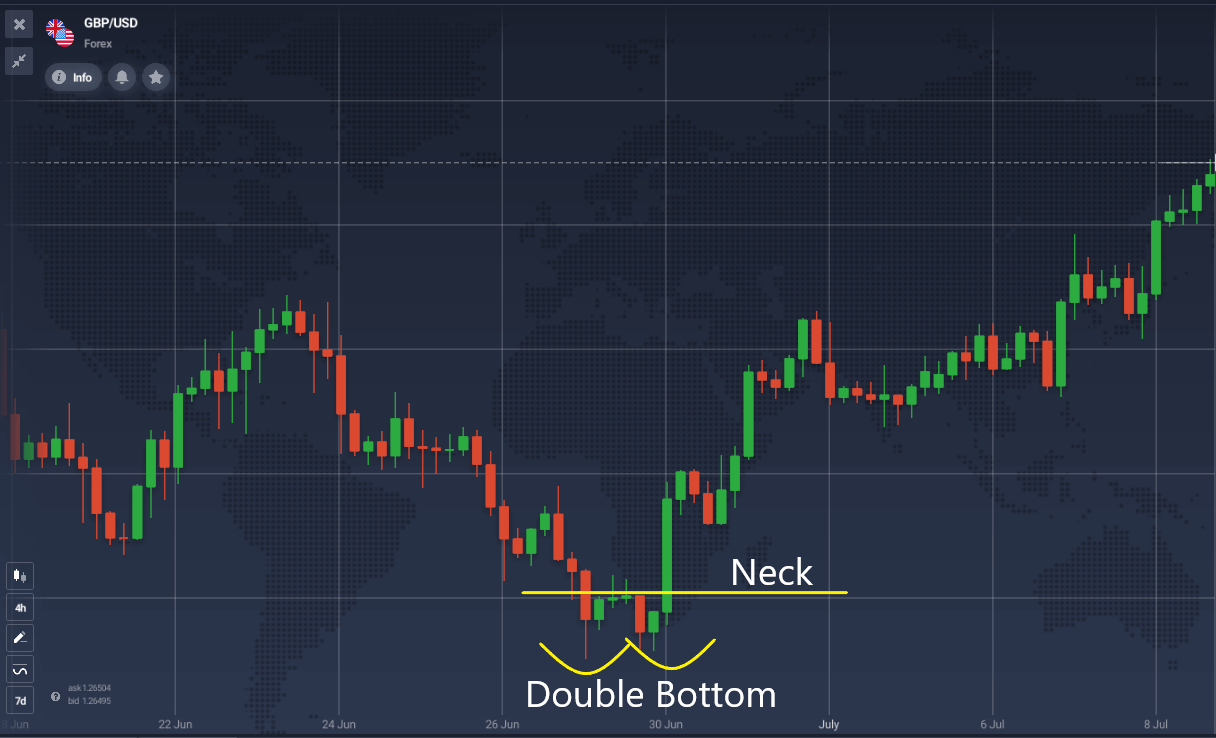
Remember, the Double Bottom (W-shape) signals that the existing bearish trend is likely ending, and the price is about to reverse.
How to Use the Double Bottom Pattern?
We’ve already described the basic principle, but there’s more to know. For example, when trading the Double Bottom, you should look for patterns where the distance between the bottoms is larger. These patterns are easier to spot and increase the chances of a neckline breakout, leading to a reversal.
So, how does it work?
Breakout Techniques
In Double Bottom trading, most traders enter the market immediately after the price breaks above the neckline, but you can try a different approach.
Instead of waiting for a clear breakout, you can observe the market closely – the price may reverse down immediately after breaking above the neckline. However, you need bullish signs, not just fluctuations. Here’s how you can proceed:
- Spot the Double Bottom pattern.
- Wait for the price to break above the neckline.
- Wait for a pullback – this could be just one candle.
- Enter long when the price breaks the swing high that coincides with the neckline.
In other words, you shouldn’t rush to open a buy order when the price breaks above the neckline. Instead, wait to see if there will be a price pullback. This way, you’ll be more certain that the bulls are much stronger when you enter the market.
When to Use the Double Bottom?
You can trade the Double Bottom pattern whenever you spot it, especially when the existing bearish trend reaches an oversold level. For this, you can use technical analysis indicators like the Relative Strength Index (RSI) or Stochastic.
It’s important to note that these two bottoms may not always be at the same level. Often, the second bottom may fall slightly lower as the bears try to push below the previous low. However, if the price bounces from the second bottom, the pattern remains valid and deserves your attention.
Keep in mind that sometimes, when such a pattern appears, bears get trapped by opening short positions right after the price breaks below the first bottom. This is a signal for the bulls because bears become demoralized when the price bounces back.
Additionally, when the second bottom is lower than the first, it’s worth checking for a bullish divergence with RSI, which would give you an even stronger signal.
What is the Double Top Pattern?
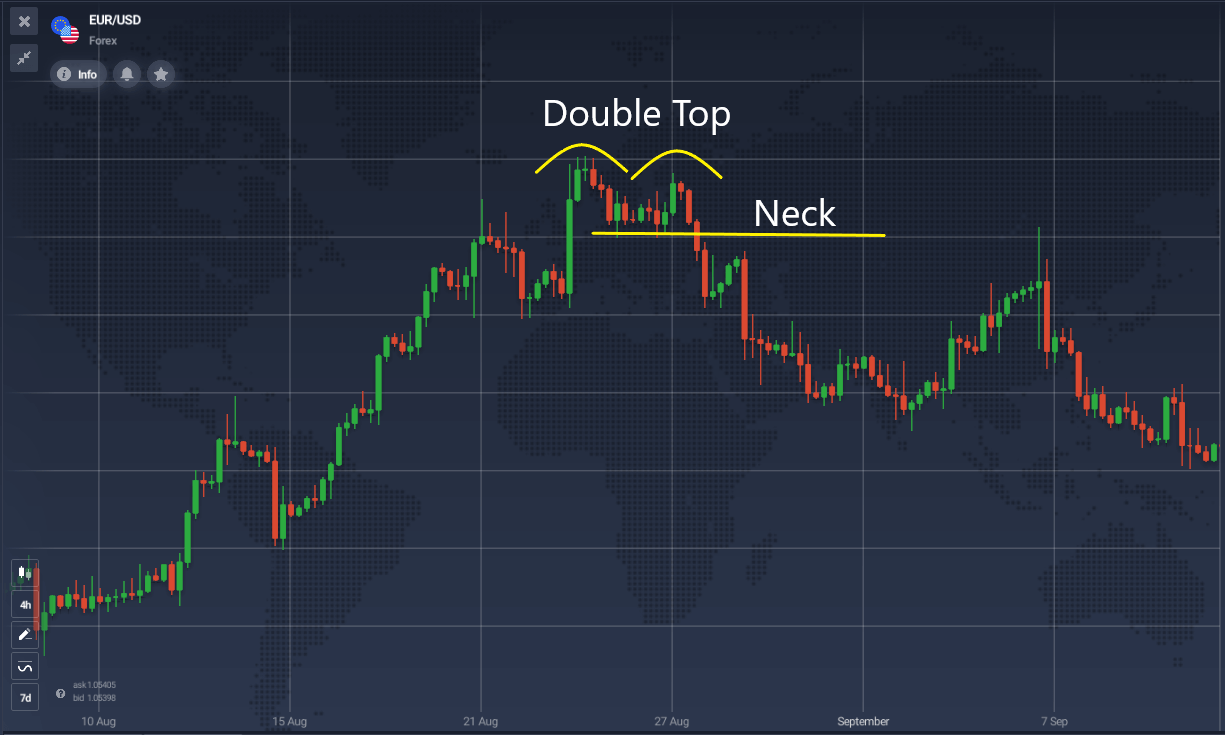
The Double Top is a bearish reversal pattern that signals the end of an uptrend. It is formed by two price peaks at roughly the same level, with a neckline acting as local support. Traders will wait for the price to break below the neckline, after which they will open short positions.
How to Spot the Double Top Pattern?
You can observe Double Tops quite frequently, though some may not be perfect. The pattern consists of three key elements:
- First Peak – the price retreats for the first time.
- Second Peak – the price retreats again.
- Neckline – the temporary support that forms between the peaks.
How to Use Double Tops?
When the market reaches an overbought level, it may encounter resistance and form the Double Top pattern. It starts with the first peak, where the price retreats until it finds local support. At this point, you won’t spot the pattern yet. After the first peak, the price retreats to the support (neckline) and then bounces back to test the newly formed resistance. If the price fails to break above it, a second peak is formed. This is when traders become cautious. They should be ready to open short positions when the price breaks below the neckline.
You can use the same breakout techniques as with the Double Bottom, but in reverse.
Can Double Bottom and Double Top Patterns Be Applied in Trading?
Definitely! These two patterns are universal and work well across all markets, including cryptocurrencies. However, their frequency of appearance may be lower than, for example, in the Forex market. Still, they carry the same significance when spotted on the chart.
Traders heavily rely on technical analysis, and chart patterns can provide some of the strongest signals. Especially when combined with technical indicators. However, crypto traders should be more cautious, considering that cryptocurrencies are highly volatile and unpredictable.
The Difference Between the Double Bottom and Double Top Patterns
There’s no fundamental difference between the Double Bottom and Double Top patterns, except that they are complete opposites. In other words, what’s true for bulls in the case of a Double Bottom is true for bears in the case of a Double Top, as the latter is a bearish reversal signal.
A Double Top consists of two peaks at roughly the same level, and the neckline represents local support at this point.
Advantages and Disadvantages
The best thing about these two patterns is that they work effectively across multiple timeframes, whether it’s M15, H1, H4, or D1. Therefore, they can be used by day traders, swing traders, and even position traders. They are also versatile patterns that work well with stocks, currency pairs, commodities, and cryptocurrencies.
Like any other technical pattern, they have their indicators, but they also have their drawbacks. The main drawback is that neither the Double Top nor the Double Bottom can guarantee the continuation of the newly formed trend. For example, in the case of the Double Bottom, bears may push prices down for a third time and even attempt to break below the support. Therefore, traders should use risk management tools like stop-loss.
Mistakes to Avoid
One of the main mistakes traders make when trading Double Bottom is opening a long position right after the price breaks above the neckline. If you’re not careful, you may find yourself trading against a larger trend. If the market is in the middle of a strong bearish move and forms a “small” Double Bottom pattern, it’s likely to ignore it and continue the overall downtrend.
To avoid this, you should add a 20-period moving average (MA). If the price is below the MA, don’t buy on the break above the neckline. When trading Double Top, the price should not be above the 20-period MA.
By following these rules, you’re likely to achieve great results with these patterns, even as a beginner. However, be sure to practice on a demo account before trading with real money.
Risk Management
Although the Double Top and Double Bottom patterns are among the most reliable formations on the chart, they can’t guarantee trend reversal in every case. To avoid significant losses that could impact your entire balance, you should apply some basic risk-reduction techniques.
The most important thing is to set a stop-loss, which is a must when trading any chart patterns. Always use a reasonable stop-loss level to minimize the chances of a losing trade. The price may pull back after breaking the neckline, and you don’t want to find yourself in a bad situation without applying risk management.
Conclusion
The Double Bottom and Double Top are powerful technical analysis tools commonly used to identify potential trend reversals. Understanding how to identify and trade these patterns is essential for both beginner and experienced traders. They can be highly effective when used in conjunction with other technical indicators, such as RSI or moving averages, to confirm reversals and enhance your trading edge.
By understanding the market psychology behind these formations, you’ll be better prepared to make informed decisions in your trading strategy.