Read Candlestick Charts Like a Pro and Enhance Your Trading Skills
Understanding the dynamics and psychology behind price action is the most important skill for strategic planning in financial trading.
Among the diverse range of techniques and tools to analyze market trends, traders use candlestick charts due to the visual clarity and wealth of information communicated in a single candlestick bar.
Line charts can display the overall trend on a graph, allowing you to assess if prices are in a bull market or a bear market, but candlestick charts offer a more profound view of the constant struggle between buyers and sellers, imprinting the emotions behind price swings.
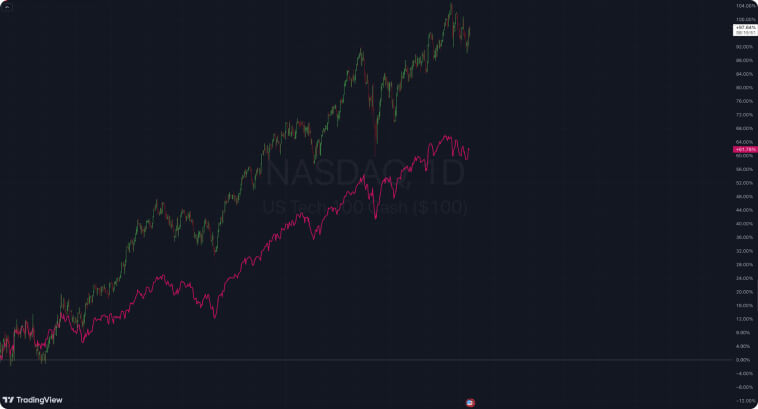
Nasdaq (Candlesticks) vs. SP500 (Line Chart)
You must master candlestick analysis if you wish to decipher market sentiment and gain insights into future price movements. In this article, we will go beyond the simple basics of chart analysis. Let’s explore the rich history and principles and learn how these figures can help us develop better strategies while trading.
History of Candlesticks

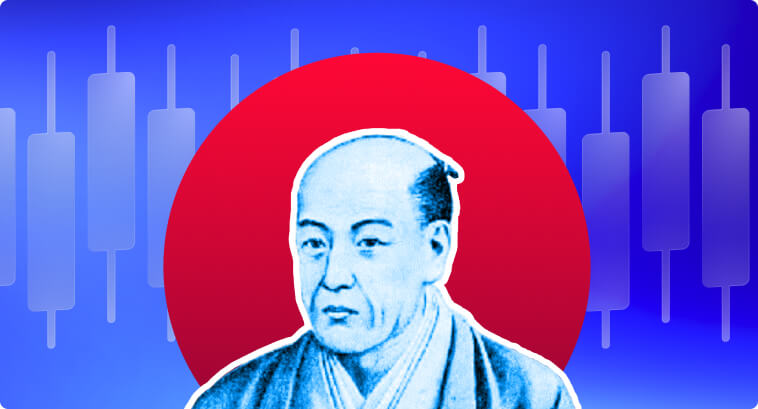
Candlesticks charts can be traced back to 18th-century Japan, more specifically to a rice trader named Munehisa Homma. In his search for a deeper understanding of price behavior beyond price points, Homma began developing a system to visually represent the opening, closing, highest, and lowest prices of the trading sessions of rice contracts.
Homma believed that the collective sentiment influenced price action, so his approach was focused on capturing the emotions driving the market.
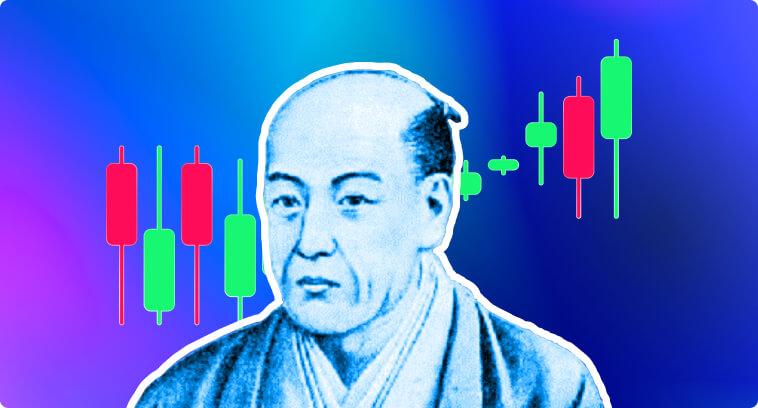
After his studies, Homma created a method that uses rectangular bodies and shadows to illustrate the trading range of a specific period (one minute, two minutes, one day, one month, etc.).
Even though this visual representation was first used to analyze rice prices in the Ojima Rice Exchange, it has been tested and proven effective across different markets, helping traders understand the main forces driving crypto, forex, and stock prices up and down and forecasting future price swings.
Homma’s method helped him make a fortune and earn fame in Japan as the God of the Markets. Although his early techniques were much simpler than the modern way of analyzing price candles, he built the foundations for what is now the most widely adopted method of price analysis across global markets.
Close, Open, High, and Low: Learning How to Read Candlestick Charts
Each candlestick bar tells a story of the trading session it represents, painting a vivid picture of the price action within that timeframe. Understanding what each candlestick conveys is essential to interpreting market conditions.
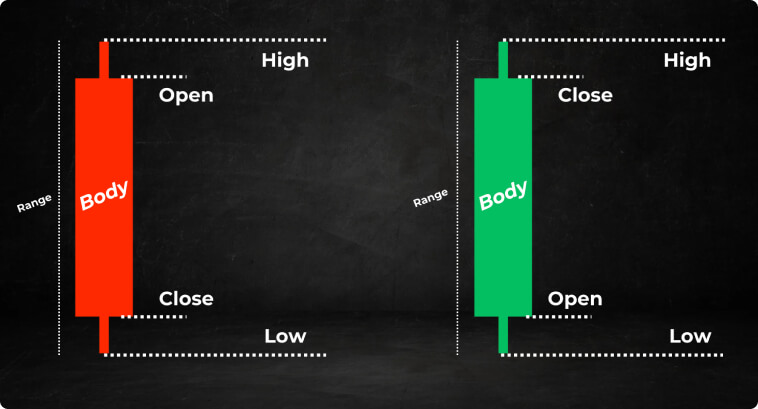
A candlestick is formed by the following elements:
- Body: The body of the candle is the rectangular part of the bar that represents the range between the opening and closing prices.
- Bullish (White or Green): This indicates that the buying pressure dominated during the period. It reflects the fact that the closing price is higher than the opening price.
- Bearish (Black or Red): This indicates that the selling pressure was stronger during that session. It reflects that the closing price was lower than the opening price.
- Upper Shadow (or Upper Wick): This is the thin vertical line that extends upwards from the top of the body. It is the highest price reached during the trading period.
- Lower Shadow (or Lower Wick): This is the thin vertical line that extends downwards from the bottom of the body. It represents the lowest price reached during the period.
Candle Body Size and Shadows
Candlesticks come in different formats and sizes. Their length and body provide many insights into the intensity of both buying and selling pressures:
- Large Body: Large bodies indicate a strong dominance of one side over another. A green candle with a large body, for example, suggests that the buy-side completely dominated the sell-side throughout the session, causing a significant price increase.
- Small body: Overall, smaller bodies indicate indecision. Both buyers and sellers are exercising balanced pressure on one another, leading to short price movements.
- Long Upper Shadow: This type of candle indicates that, although buyers initially pushed prices higher, sellers eventually stepped in with more strength, forcing the price back down. This can sign potential trend reversals or suggest a strong point of price resistance.
- Long Lower Shadow: This has the same meaning as the long upper shadow, but the other way around. Long lower shadows show that, although sellers initially drove prices lower, buyers entered the market with more strength, pushing the price back up. It also might indicate a price reversal or a strong zone of support.
- Absence of Shadows (Marubozu): A candlestick without upper and lower shadows suggests a very strong directional momentum throughout the trading period. A bullish marubozu shows persistent buying pressure, whereas a red candle in the form of a bearish marubozu implies relentless selling pressure.
Candlesticks can represent several timeframes, from one minute to months. The timeframe you pick will define the significance of the impact and interpretation of the candlestick:
- Short Timeframes (e.g., 1 minute, 30 minutes): Imprint short-term price action and are usually used by day traders and scalpers for quick entries and exits.
- Medium Timeframes (e.g., Daily): They give a broader perspective of price action and trends. Daily charts are preferred by swing traders and position traders.
- Long Timeframes (e.g., Weekly, Monthly): They offer a long-term view of market context and price action. They are widely used by position traders and long-term investors to identify entry points, strong support and resistance, long-time investment planning, etc.
The longer the timeframe, the more significant the candlestick patterns tend to be. A bullish engulfing candlestick on a weekly chart, for example, carries much more weight than the same pattern on a 15-minute chart.
Trading Candlestick Patterns: From Bullish to Bearish
Candlesticks convey relevant information on market trends, price, demand, and supply, among many others. You can divide candlesticks into bearish and bullish.
Candlesticks also form patterns. Some patterns are formed by one candlestick alone, whereas others are formed by a combination of several candlesticks together.
Below, we will take a look at some of the most important candlestick patterns you will encounter on a price chart.
Single Candlestick Chart Patterns
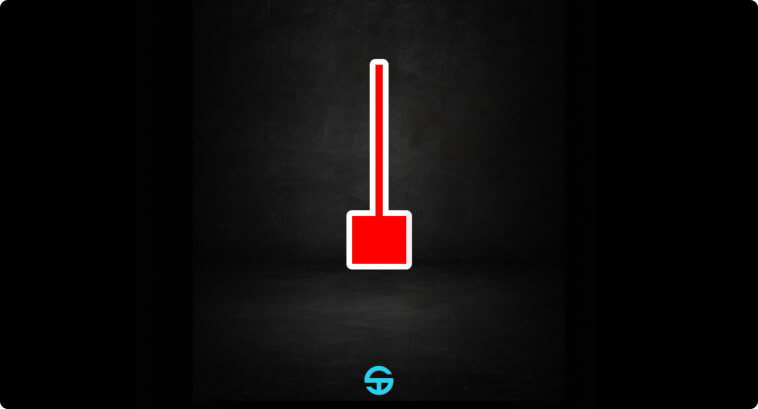
Hammer
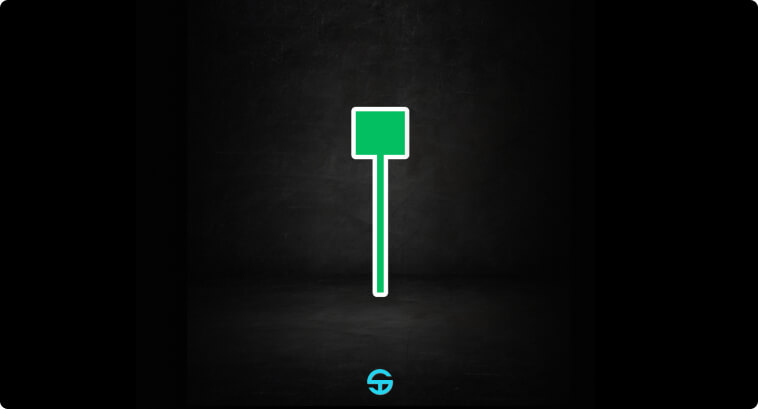
- Context: Appears at the bottom of a downward trend. The hammer candlestick is characterized by a small body at the upper end of the trading range with a long lower shadow.
- Type: Bullish
- Reliability: Moderate to High
- Formation Conditions: There must be a clear downtrend preceding the pattern. The lower shadow must be at least twice the length of the body.
Hanging Man
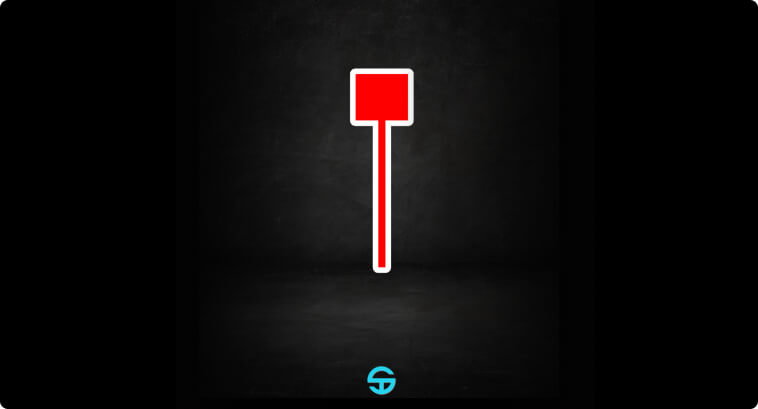
- Context: Appears after an uptrend. It has the exact same shape as the Hammer, but it appears at the peak of bullish trends.
- Type: Bearish
- Reliability: Moderate
- Formation Conditions: There must be a clear uptrend before the appearance of the pattern. The lower shadow must also be at least twice the length of the body. It is recommended to wait for confirmation with subsequent bearish candles. Some traders defend the idea that the Hanging Man is a bullish continuation pattern, but classical technical analysis defines it as a bearish reversal pattern.
Shooting Star
- Context: Appears after an uptrend. It has a small body at the lower end of the trading range with a long upper shadow.
- Type: Bearish
- Reliability: Moderate to High
- Formation Conditions: There must be a clear uptrend before the appearance of this pattern. The long upper shadow should also be twice as long as the body.
Double Candlestick Patterns
Piercing Line
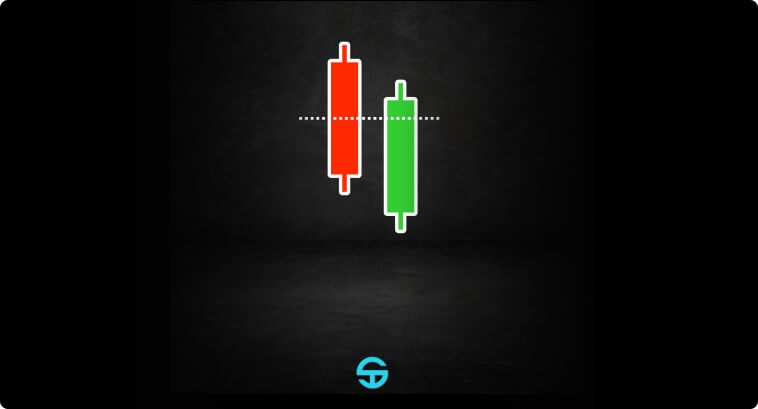
- Context: It appears during a downtrend. It is characterized by a bullish candlestick that opens lower than the previous bearish candle’s close but closes more than halfway into the previous candlestick’s body.
- Type: Bullish
- Reliability: Moderate to High
- Formation Conditions: It has to appear at the bottom of a very clear downtrend. The second candle must close higher than the midpoint of the first candle.
Bearish Engulfing
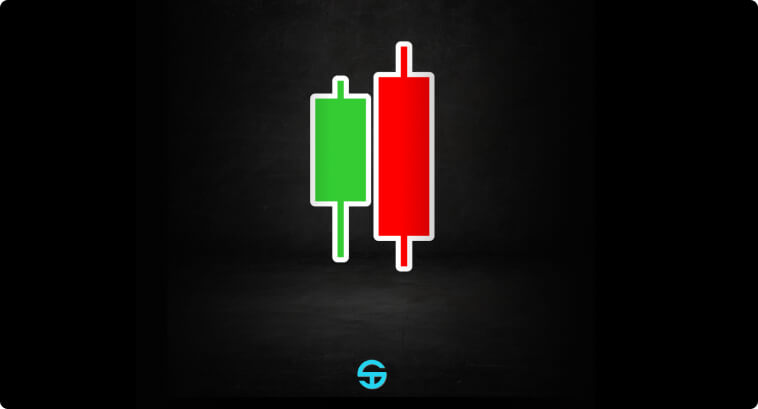
- Context: It appears during an uptrend. It is formed by a bearish candlestick that completely engulfs the previous bullish candlestick. The second candle has an overall trading range that is larger than the trading range of the first candle.
- Type: Bearish
- Reliability: Moderate to High
- Formation Conditions: It has to appear at the top of a very clear uptrend. The second candle should open above the first candle’s close, and it should also close below the first candle’s open.
Tweezer Bottom
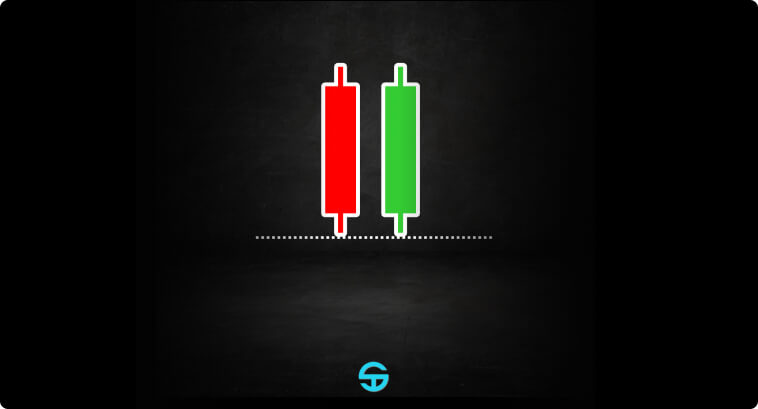
- Context: It is characterized by two consecutive candles with the same low.
- Type: Bullish
- Reliability: Moderate to High
- Formation Conditions: It must appear during a mid-to-longer term downtrend. Both candles should have the exact same low.
Triple Candlestick Patterns
Morning Star
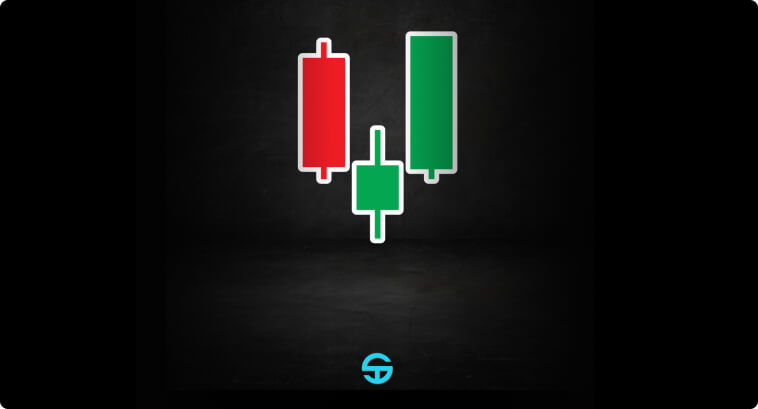
- Context: This pattern consists of a large bearish candle, followed by a small-bodied candle that can be either bullish or bearish, and then a large bullish third candle.
- Type: Bullish
- Reliability: Moderate to High
- Formation Conditions: It has to occur during a downtrend. It is preferred that the second candlestick gaps down.
Evening Star
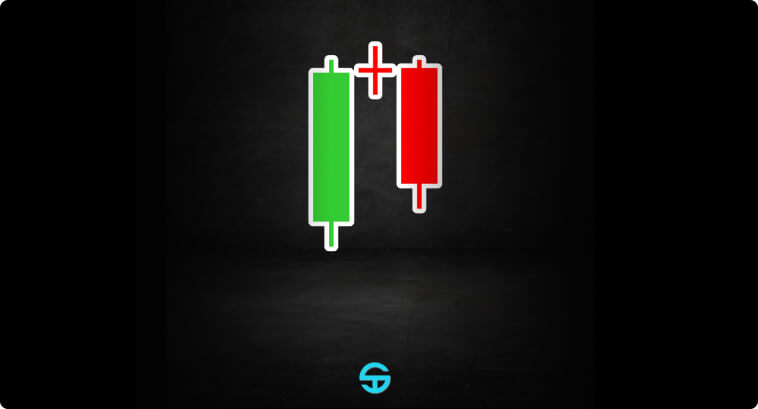
- Context: This pattern is the bearish version of the Morning Star. It consists of a large bullish candle, followed by a smaller-bodied candle that gaps up, and then a final bearish candle.
- Type: Bearish
- Reliability: Moderate to High
- Formation Conditions: It has to occur during the peak of a clear uptrend. It is preferred that the second candlestick gaps up.
Three White Soldiers
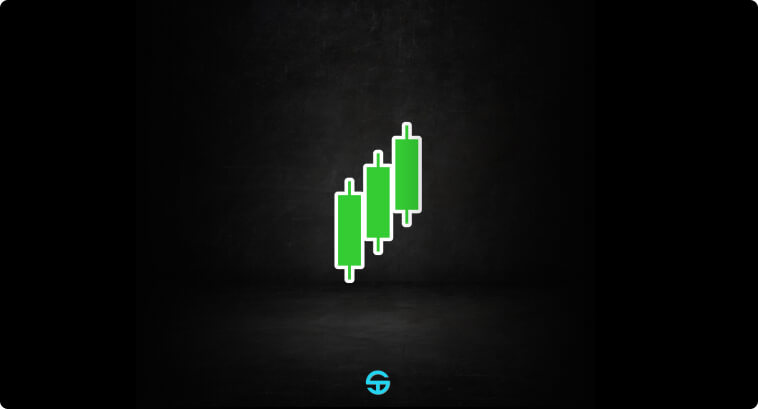
- Context: This pattern appears at the bottom of downtrends. It consists of three consecutive bullish candlesticks, each closing higher than the previous close and opening within the previous body.
- Type: Bullish
- Reliability: High
- Formation Conditions: It has to occur during a downtrend.
Special Candlestick Patterns
Distinct from the patterns above, some other candlestick patterns convey different aspects of market psychology. In this session, we will explore patterns that translate decisive strength, indecision, and surge in volatility onto candlestick price charts.
Marubozu

- Context: This candlestick has no shadows. They imply an extremely strong dominance of buyers (when green) or sellers (when red)
- Type: Bullish or Bearish
- Reliability: Very High
- Formation Conditions: They can appear anywhere on price charts and can work as a reversal or continuation candlestick. It has to be taller than previous candles.
Doji

- Context: The Doji is characterized by a small or non-existent body, meaning that the opening and closing prices are either very close or essentially the same. Doji candlesticks indicate indecision, a trading session where neither bulls nor bears overpower each other.
- Reliability: Moderate
- Formation Conditions: Dojis can have different formats. There are names for each type of Doji (e.g., Dragonfly Doji, Gravestone Doji, etc.). Some Dojis work as a continuation pattern, whereas others are highly reliable reversal patterns.
Spinning Top
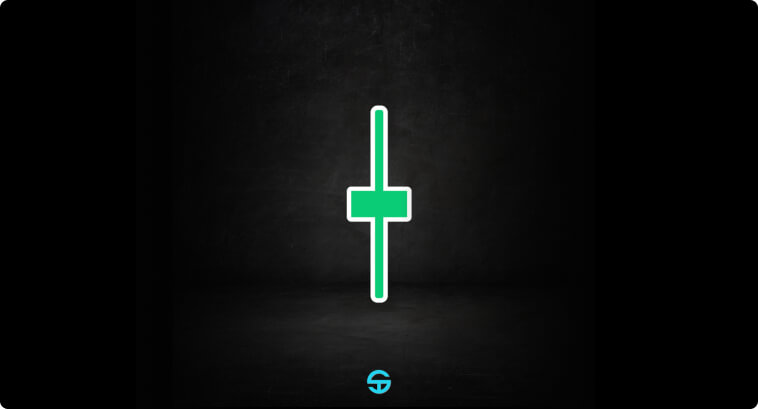
- Context: Spinning Tops are characterized by a very tiny body and long shadows. They convey the idea of a surge in market volatility and can indicate the possibility of a price reversal depending on where they appear on price charts.
- Reliability: Moderate
- Formation Conditions: They can serve as either continuation or reversal patterns. Evaluating market context becomes even more essential when analyzing Spinning Tops and Dojis.
Swing and Day Trading with Common Candlestick Patterns
Although candlestick patterns offer highly valuable insights into the psychology of market participants, they should never be interpreted in isolation. The overall trend and market structure are important considerations. Reversal candlestick patterns are much less reliable in range-bound markets, for example.
Another important aspect to take into consideration is trading volume. Trading volume indicates the level of participation and conviction behind price movements. High volume during the formation of candlestick patterns–especially breakouts–suggests strong interest and a confirmation of the signal. Low volume, on the other hand, indicates a lack of conviction and participation, making the pattern much less reliable.
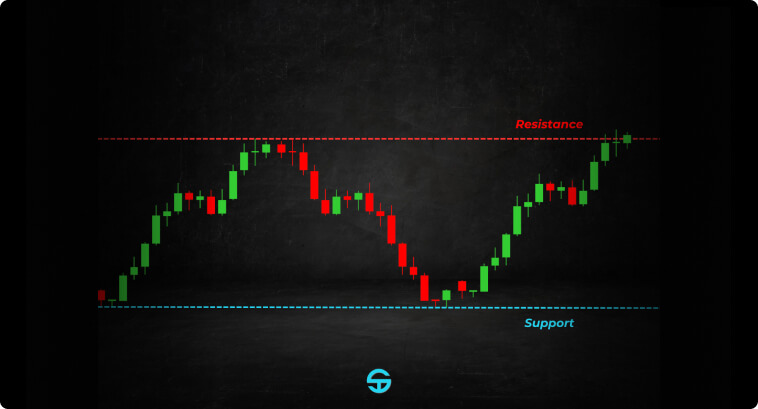
Candlestick patterns are much more significant when they form near relevant support and resistance levels. A bullish reversal pattern like the Hammer, accompanied by a surge in volume near a support level, suggests an increasingly higher probability of an uptrend after a downward trend. A Hanging Man, on the other hand, accompanied by a spike in volume near a key resistance level, increases the likelihood of a decline in prices.
Candlestick analyses are proven to work much more effectively when combined with trendline analysis techniques and support/resistance price levels.
Practical Applications of Candlestick Chart Patterns
You must develop a systematic approach to effectively apply candlestick analysis to your trading system. A step-by-step guideline would follow a similar structure as the one outlined below:
- Identify the Trend: Determine the overall trend direction (sideways, bullish, or bearish). You can do that by analyzing higher timeframes or using moving averages.
- Identify Patterns: Scan the chart for recognizable candlestick patterns. Trading platforms like TradingView offer indicators you can use to autonomously pinpoint candlestick patterns on a chart for free. You can search for key candlestick patterns such as the Hammer candle, Marubozu, and Engulfing to find indicators dedicated to identifying and highlighting each one of these patterns.
- Consider the Overall Context: Analyze the location of the pattern. Does it appear around key support and resistance zones? Is there any other indicator suggesting that the pattern can be significant given the context (e.g., a bullish Marubozu appearing when RSI is under oversold conditions and there is a surge in trading volume)?
- Moving Averages as an Indicator: Moving averages can help you identify long-term, mid-term, and short-term trends, giving you a broader understanding of the market context. You can find several opportunities by combining shorter moving averages with longer moving averages and identifying entry points during pullbacks.
- RSI as an Indicator: Identifying overbought and oversold conditions with RSI can help you identify price zones where bullish and bearish momentum are reaching exhaustion points. The RSI serves as a great ally in measuring the relevance of candlestick patterns.
- MACD as an Indicator: Candlestick patterns aligned with MACD crossovers or divergences can highly increase confidence before entering a trade.
- Evaluate the Trading Volume: Check if the trading volume is higher than the average during the pattern’s formation. Candlestick patterns formed under lower-than-average volume are less reliable.
- Wait for Confirmation: Besides using additional indicators for confirmation, you should also wait for confirmation from subsequent candles. For instance, after identifying a bullish Hammer, you should wait to see if the following candle will confirm the reversal (e.g., a long-bodied green/white candlestick and large trading volume).
- Define Entry and Exit Points: Each pattern might have different strategies for entry and exit points. This decision also varies according to risk appetite. Establish stop-loss levels and profit targets before entering the trade.
- Risk Management: Risk management separates traders who reach long-term success from those who don’t. Focus on the long-term goals instead of the current trade. Don’t risk more than 2% of your trading account on a single trade, and have well-defined stop-loss orders to avoid losing more than you are willing to.
Overall, candlestick patterns are more effective when in conjunction with additional indicators and in longer timeframes, where they are more reliable and reflect more significant shifts in market sentiment. Although candlestick patterns can be a part of short-term trading strategies, longer timeframes are preferred for those who look for a higher degree of confidence before entering trades.
Let’s take a look at some examples down below:
S&P 500 Index (SPX) – 1d
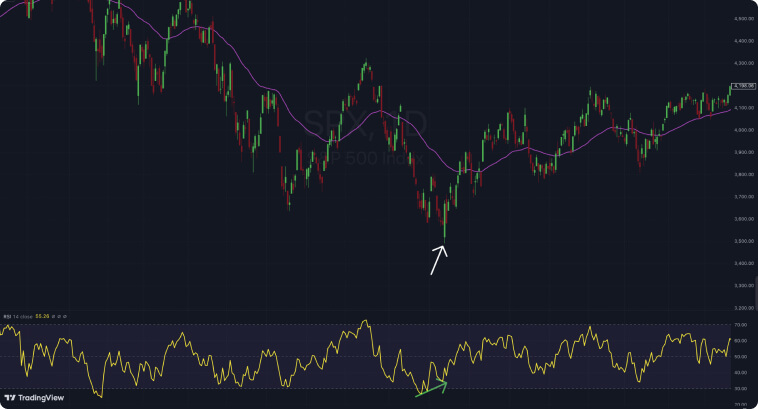
- Context: A bullish engulfing pattern appears at the bottom of a downtrend (prices below 50-EMA) in a daily chart. It engulfs all three candles preceding it and is also taller than the average.
- Indicator Confluence: The RSI not only seems to have reached oversold conditions right before the appearance of the engulfing pattern, but it also displays a divergence with the price (i.e., while the price is making lower lows, the RSI is making higher lows). Prices below the 50-EMA also show that the mid-term trend is bearish, giving more relevance to the pattern as a bullish reversal sign.
- Entry Point: A riskier entry point would be at the engulfing candle’s high. More cautious traders could wait for prices to crossover above the 50-EMA.
- Stop Loss: A stop-loss order could be set right below the engulfing candle.
- Take Profit: Take-profit levels could be set at previous highs, at 4,300 or 4,600. A trailing stop strategy could also be employed here.
XP Inc. (XP) – 1w
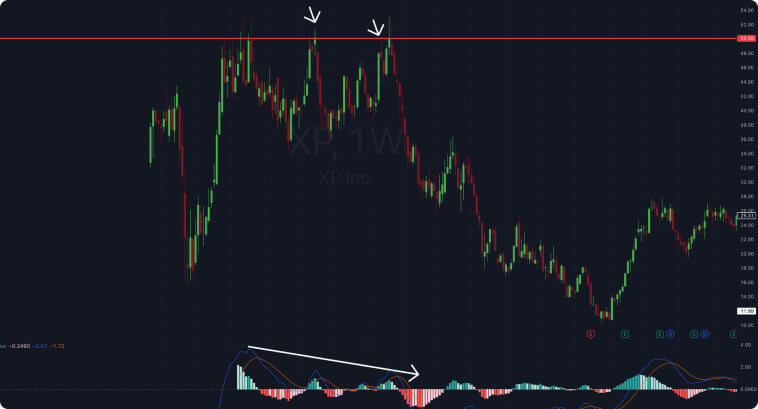
- Context: A Spinning Top first appears near a resistance level at $50.08 on a weekly chart, suggesting a weakening bullish momentum at a relevant price zone. A Shooting Star pattern forms some weeks later near the same resistance level after another attempt to break out. Both patterns preceded a downward movement at a key price zone.
- Indicator Confluence: There is a clear bearish divergence on the MACD. While the price is attempting to break out the resistance level, the MACD is forming lower peaks, indicating that bulls are getting weaker over time and are losing momentum for a breakout. This highly favors bears.
- Entry Point: A potential entry point for a short position would be at the low of the Spinning Top or at the low of the Shooting Star.
- Stop Loss: A stop-loss order could be placed slightly above the resistance zone.
- Take Profit: Take-profit levels could be set at previous lows, such as $36.00 and $16.00.
S&P 500 Index (SPX) – 60m
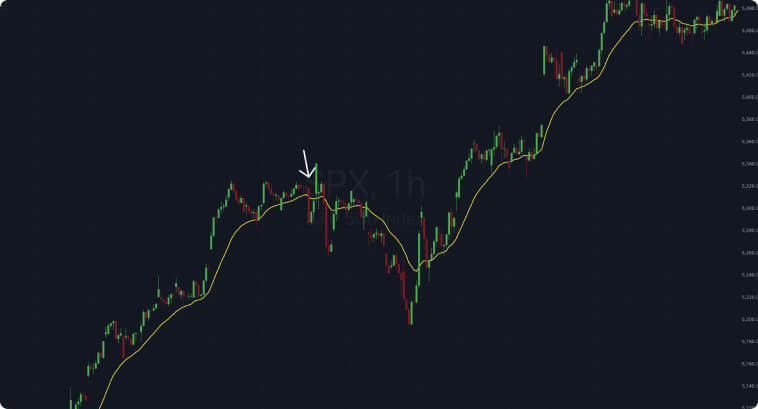
- Context: A bearish Marubozu appears on an hourly chart. This candlestick has no upper or lower shadows, indicating strong selling pressure during the one-hour timeframe it was formed.
- Indicator Confluence: The bearish Marubozu breaks below the 20-period EMA, suggesting a possible shift from bullish to bearish. Even though bulls displayed a strong reaction after the Marubozu, prices still went down for the next few hours before resuming the uptrend.
- Entry Point: An entry point for a short position would be at the close of the Marubozu or on a break below its low in the next candle.
- Stop Loss: A stop-loss order could be placed slightly above the Marubozu’s high.
- Take Profit: Take-profit levels could be set at previous lows or Fibonacci retracement levels, giving the overall uptrend.
The key takeaway, however, is how erratic shorter timeframes can be. Even though the Marubozu is a reliable pattern, prices went back up before resuming the falling movement, probably triggering several stop-losses set by traders who went short.
Overcoming Typical Mistakes
There are two emotions behind every trader’s decision: Fear and greed.
Beginners’ most common mistake is letting any of these sentiments take control over their decision-making. A beginner’s greed will make them go out hunting for candlestick patterns, leading to misidentification or finding figures that are not relevant given the context (e.g., a bullish engulfing in a range-bound market or a Marubozu in a low-liquidity penny stock). Focusing on isolated candlesticks without market context and treating every pattern as a guaranteed signal are among the most frequent pitfalls.
Avoid false signals by always considering the overall trend and seeking reversals at trend corrections or relevant support and resistance levels. Moving averages and Bollinger Bands can work as dynamic support and resistance zones, giving more flexibility to enter trades (although this would be more suited for traders who are more prone to risk).
Have patience and wait for confirmation from subsequent candles, volume, and indicators. If you internalize that greed makes you chase trades and become mindful of that while analyzing the markets, you will be able to keep track of your emotions, ignore false signals, and find real opportunities.
Closing Arguments
There is no doubt that candlestick charts provide a powerful and straightforward way of analyzing the markets. Learning the basics of candlestick chart interpretation is fairly easy, serving as a good starting point for newcomers in trading and financial markets.
If you are considering applying candlestick figures and patterns to your trading system, be sure to use them in combination with additional technical indicators and tools for better reliability. Identifying patterns with the naked eye can also be tricky, so leverage tools to automatically screen and identify patterns for you. The candlestick patterns we approached in this article can and should be used in conjunction with more complex price chart patterns, such as the ABCD pattern and the ascending triangle pattern.
Avoid poor judgment that comes from excessive greed and fear by keeping track of your emotions. Backtest any trading system you design to ensure its reliability and robustness in the face of drawdowns. You can also integrate candlestick analysis with algorithmic trading strategies for further refinement and automation.