Technical analysts use price action and volume to evaluate momentum. They use momentum indicators to highlight when prices have risen so quickly they need to slow down or drop a little before they can continue rising. Overbought is a statistical extreme.
Fundamental analysts keep their eyes on intrinsic value. They evaluate financial statements, revenue growth, earnings-per-share, and other fundamental indicators to assess the financial health of a company. If the stocks are skyrocketing, but the financial data stays the same, fundamental analysts conclude the valuation has become detached from reality.
| Analysis Type |
Focus on |
Overbought Definition |
Tools |
| Technical |
Price and Volume |
Prices deviate too far from the mean |
RSI, Stochastics, Bollinger Bands, Moving Averages |
| Fundamental |
Financial Health |
Price exceeds intrinsic value |
P/E ratio, DCF Models |
At the end of the day, collective psychology pushes prices to extremes. Fear of Missing Out, for example, is a common driver.
As prices keep going higher, those who are out feel psychologically pressured to join the rally. When that happens, prices move even further. Eventually, everyone will have already bought, so no one else remains to push prices even higher. That’s when things start to get complicated. The state of the price becomes so fragile that even minor negative news trigger a cascade of massive selling.
Defining Overbought Conditions Using the RSI
The RSI is my favorite indicator to identify overbought and oversold conditions. It was created by the legendary J. Welles Wilder Jr. in the 80s and has been since then the number one indicator to measure the speed and change of price movements.
The RSI ranges from 0 to 100. Readings over 70 indicates a market in an overbought state. Readings below 30 indicates prices have reached an oversold condition.
Take the prices of Crude Oil Brent for example. You can see how a rally starts by the beginning of March, as the conflict between the US and Iran starts to get heated. The RSI, which was already near the 70 threshold, explodes to almost 90 while prices keep pushing higher and higher. Notice that, although the RSI highlights overbought conditions, prices do not come down, they instead slow down and keep swinging around the high. Markets can stay on the extremes for a long time, especially during extraordinary conditions, such as the conflict in the Middle East.
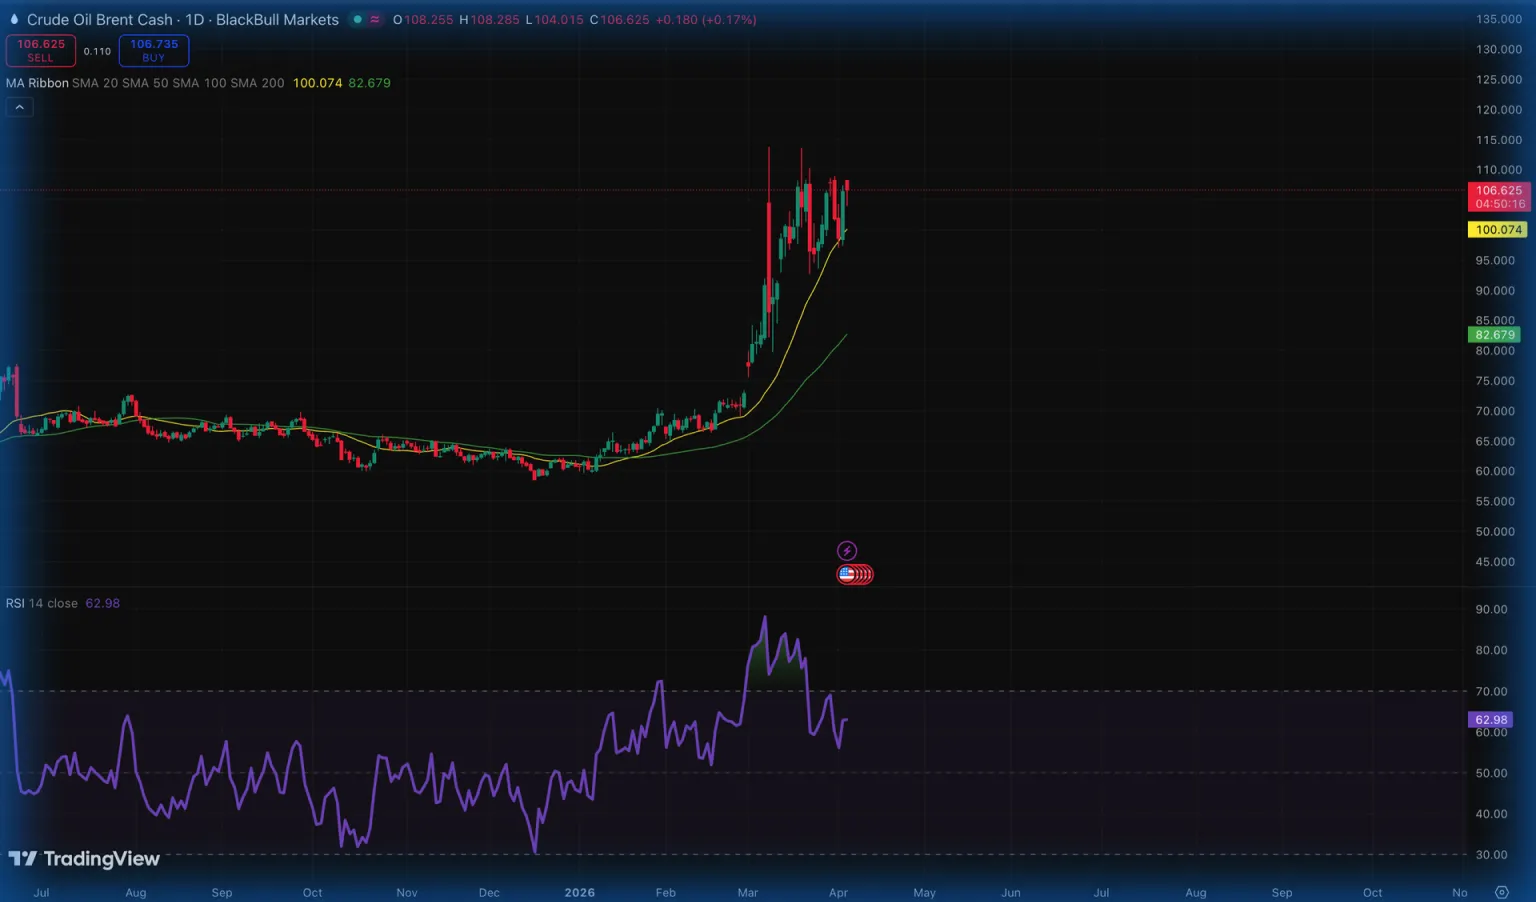
It should be clear to you, by looking at the price chart above, that RSI > 70 doesn’t automatically mean you should sell.
But another strength the RSI possess is telling us when divergence happens. A Bearish Divergence is what we call when prices make new highs but the indicator makes a lower high. This mismatch suggests that the strength behind new highs is fading and the opposite side is gaining force to drive prices down in the near future.
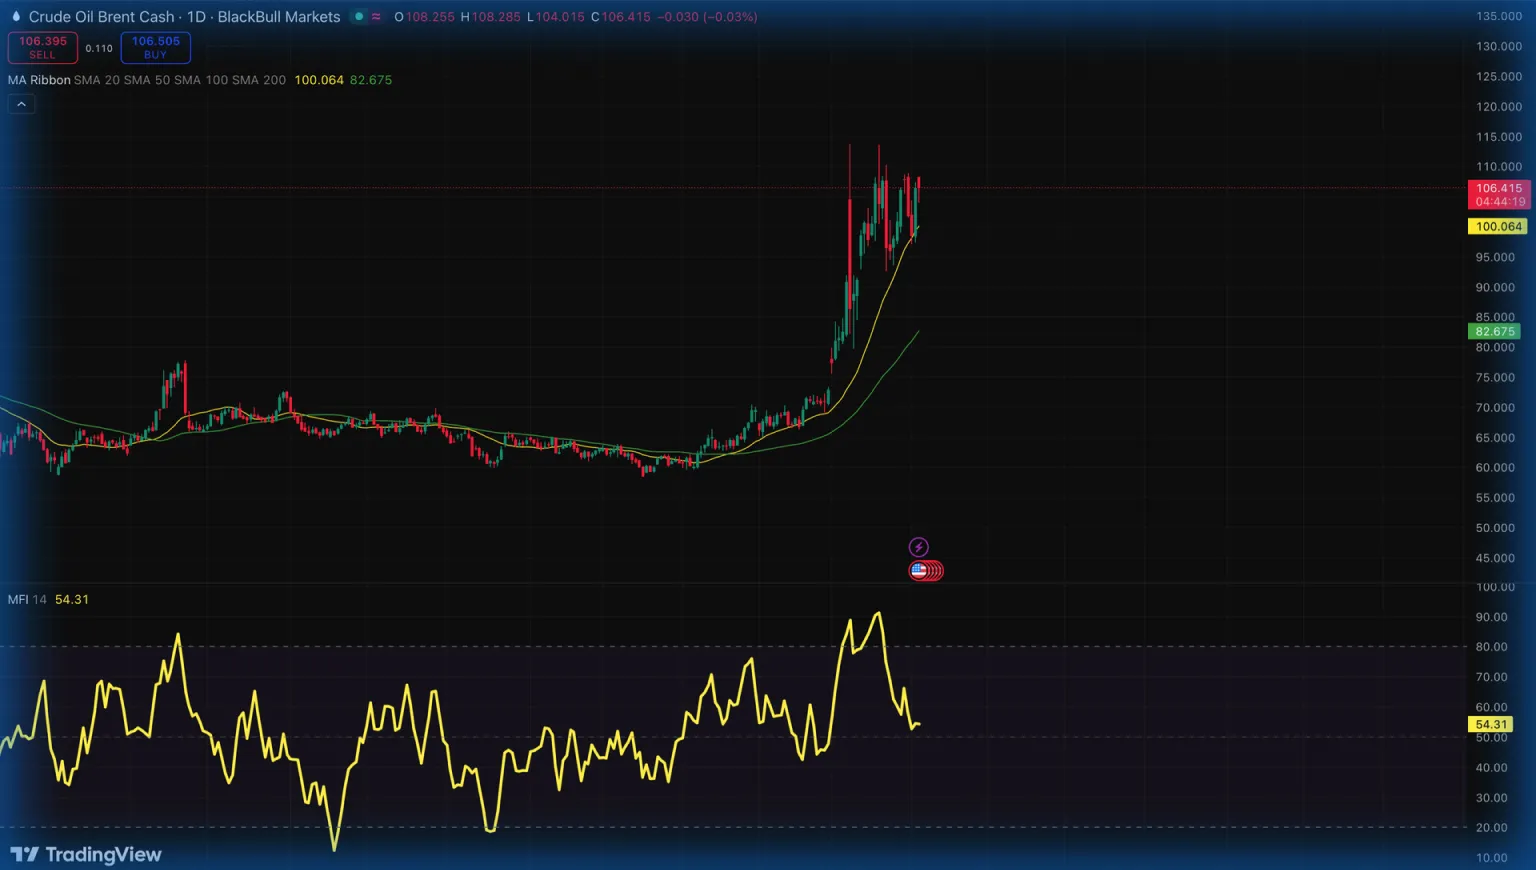
One interesting variation of the RSI is the Money Flow Index. It is simply a volume-weighted RSI. If a price hits a new high but the MFI declines, it shows us that the smart money is quietly exiting. This divergence often foreshadows a major peak. You can see how the MFI behaves in the image below.
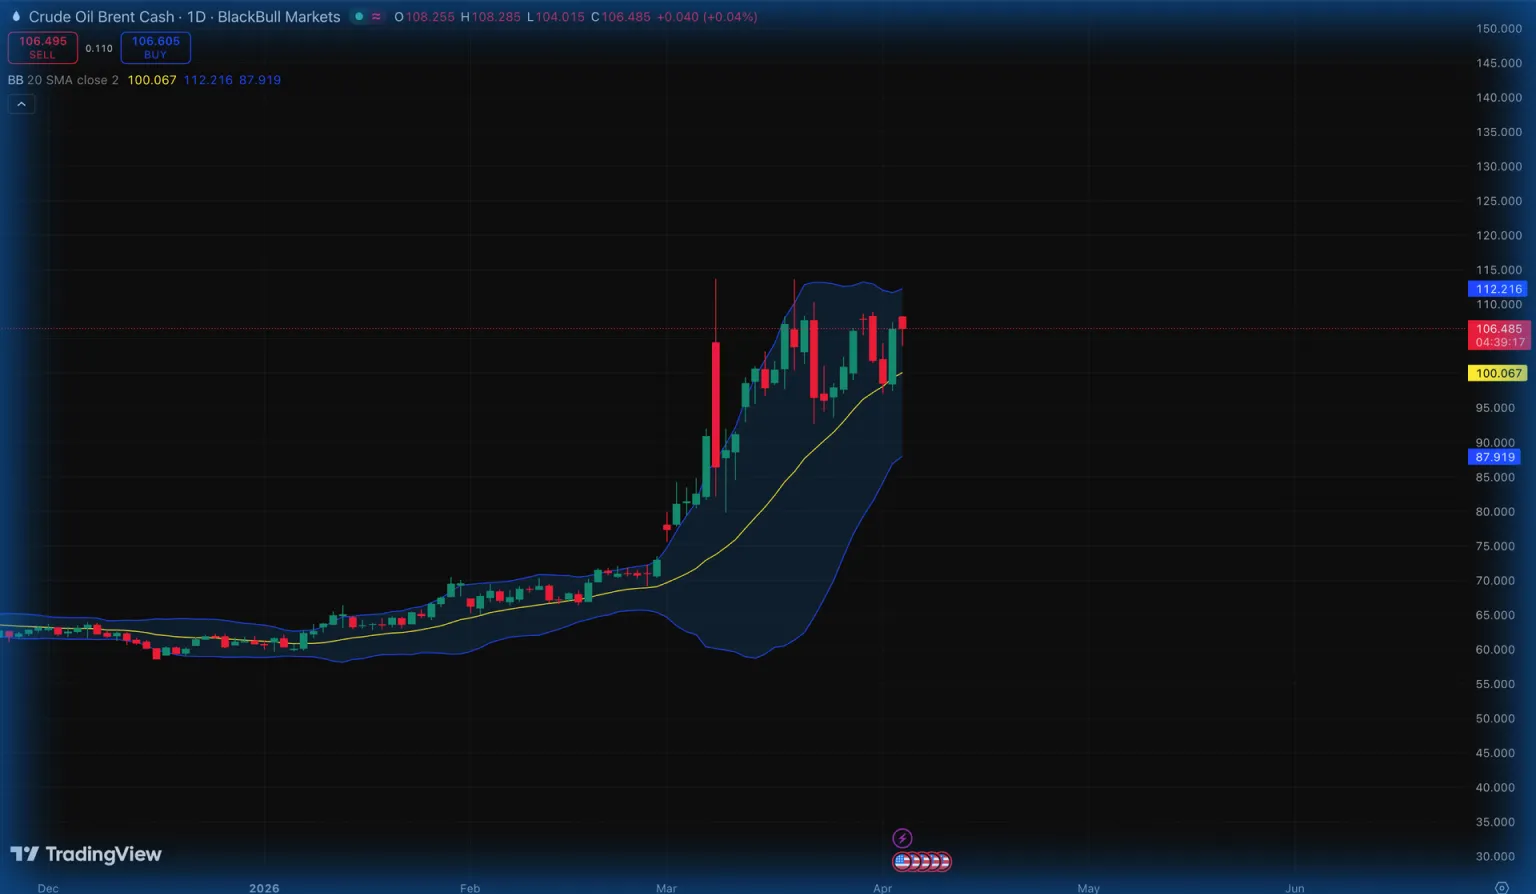
Other indicator options include the Bollinger Bands, which are more volatility-based. These bands represent standards deviation from a middle moving average. When prices break through the upper band, it represents an extreme deviation relative to the most recent volatility. This breakout is not necessarily a sign to sell. In strong trends, prices can walk along the upper band for a while. When structural shifts happen, the bands will follow the price, instead of the opposite. Here’s the same Crude Oil Brent example with the Bollinger Bands.
False Signals and RSI Limitations
As previously mentioned, treating an overbought reading as a definitive sell signal is a classical mistake.
Massive trends can be caused by a variety of factors. They can be institutional-driven or a result of unexpected news. And when rallies start getting traction, we have the effect of FOMO to come in and push prices even higher. The move becomes so strong, that it is foolish to go against it. Trying to hit the jackpot and sell at the peak of the trend is a guaranteed way to lose money.
Technical traders use additional indicators besides the RSI to help them make the best decisions. They include moving averages, the Average Directional Index, volume analysis, candlestick patterns, among many others. Besides that, indicators are not all you need. They also employ strict risk management rules to protect their capital and reduce the chances of low-probability entries.
We have several examples throughout history about how markets can stay under the extremes for a long period of time. during the dot-com bubble of the 2000s, internet-based stocks maintained massive valuations for years up until the bubble burst. The NASDAQ kept stretched far longer than anyone anticipated and lost over 70% of its value when things came crushing down year later.
What Do I Do If a Stock Looks Overbought?
We can build guidelines based on two different perspectives. One revolves around the idea that you are managing an open position in an overbought stock. The other revolves around the idea you don’t have an open position.
Managing Open Positions
- Instead of panic-selling, you must employ a smart exits strategy. We want to protect gains without cutting a winning trade too short.
- Employ a trailing stop, which follows the price upward at a defined percentage or distance. If prices reverse suddenly, the system will lock your profits automatically.
- Instead of selling the entire position all at once, sell them in chunks. For example, sell 30% of the position when the RSI hits 75. You then sell another 30% if the price breaks a short-term SMA. You can capture profit, but still keep some skin in the game in case the rally continue.
Entering Positions
- If you don’t currently hold any position and you see the asset is under overbought conditions, you got to have patience.
- Entering the trade at the peak has the worst risk-reward ratio possible. Wait for a market pullback.
- A healthy correction in a bull market comes with a price drop of 5 to 10% and the RSI returns to a neutral zone (around 50). You can also use Fibonacci Retracement levels to find optimal entry points.
- If your goal is to short-sell and enter aiming at trend reversals, it is ideal to wait for candlestick patterns. The formation of a lower higher, increased volume, and a short-term SMA turning into a resistance are all good signals the trend might reverse.
For all of the strategies outlined above, risk management is mandatory. As I always suggest, you should not risk over 2% of your total trading account in a single trade. Stop-loss orders are also mandatory to help cut losses short when things don’t go as planned.
Conclusion
One of the main advantages of understanding overbought and oversold conditions is that it gives you the potential to make smart decisions when markets are trending, but also when they’re range-bound. So it gives you power to make your moves, regardless of market conditions, and across different asset classes.
Overall, the principal takeaway from this article is to never become overreliant on a single tool. Do not use RSI readings to choose when to enter or exit a position. Smart decisions and successful trades will come from a combination of indicators plus a mature understanding of the forces behind price action. Not to mention the control over your own psychological biases.
Use demo accounts and keep a trading journal to keep track of your trading system. You will never reach a perfect system, but you can improve it through iteration and analysis. Don’t let setbacks discourage you. Take every single trade as a lesson, some of them will be profitable, but others will be costly. Risk management guarantees you’ll be able to come back tomorrow and try again.
The discipline you build today serves as the foundation for your long-term success in financial markets. Stay focused and stay hungry.