The Head And Shoulders Pattern: A Powerful Chart Pattern for Trading
Learn how to trade the head and shoulders pattern, a powerful chart pattern for spotting trend reversals in technical analysis. Master the head and shoulder chart pattern for successful trades.
Introducing one of the most powerful technical analysis patterns: the Head and Shoulders pattern
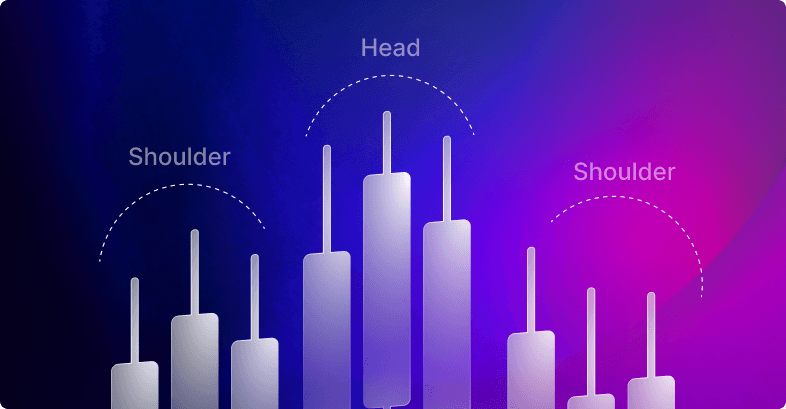
The Head and Shoulders pattern is a popular chart pattern that predicts reversals in both bullish and bearish trends. The pattern is characterized by three peaks: a higher peak (the head) with two lower peaks (the shoulders). It marks a potential change in market direction at the top of a trend (a typical Head and Shoulders pattern) or at the bottom of a trend (also known as an Inverse Head and Shoulders pattern). Recognizing and understanding this pattern can be a valuable skill for traders looking to profit from price action.
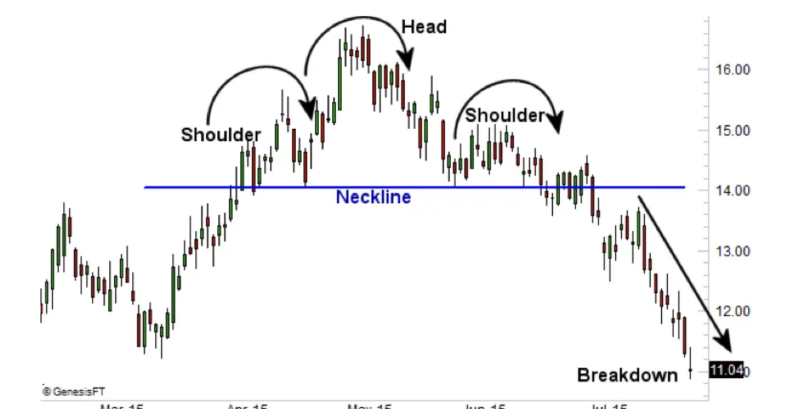
This pattern is formed over a period of time and consists of four main components: the left shoulder, head, right shoulder, and neckline. The left shoulder is formed after a significant price increase followed by a temporary decline. The head is formed when the price rises again, forming a higher peak before another decline. The right shoulder is formed when the price rises again but does not reach the height of the head, followed by another decline. The neckline is drawn by connecting the lower points of the shoulders.
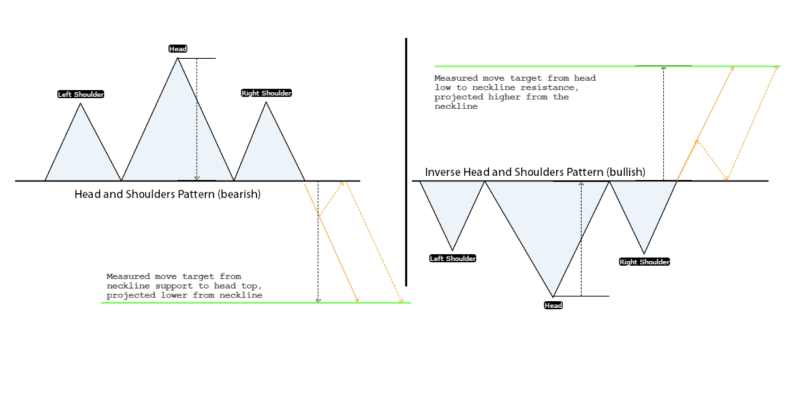
The importance of the Head and Shoulders pattern is its effect as a trend reversal pattern. In a Head and Shoulders formation, a break below the neckline indicates a change from a bullish uptrend to a bearish downtrend. However, in a reverse Head and Shoulders pattern, a break above the neckline indicates a change from a bearish downtrend to a bullish uptrend. Highly skilled traders use these patterns to enter or exit trades effectively.
To use the Head and Shoulders pattern effectively, it is necessary to confirm its validity and strength. This includes looking for a clearly defined neckline and ensuring that the shoulders are roughly equal in height and width. Trading volume should also be considered, as a decrease in volume during the pattern’s formation and an increase at the breakout point can increase the reliability of the signal.
The History Behind the Head and Shoulders Chart Pattern
The head and shoulders is a trading pattern with a long history in technical analysis. It is widely believed to have originated from the early work of Charles Dow, the father of technical analysis and co-founder of Dow Jones & Company. Dow’s pioneering work in the late 19th and early 20th centuries laid the foundation for modern technical analysis, and the head and shoulders pattern is considered one of many concepts that evolved from his principles. The model gained widespread recognition and theoretical grounding through the work of Richard W. Schabacker in the 1930s, and later by John Magee and Robert D. Edwards in their seminal book ” Technical Analysis of Stock Trends,” published in 1948. This book is considered a cornerstone of technical analysis and presented the Head and Shoulders pattern as a reliable tool for identifying reversals in bullish or bearish market trends. Schabacker, Magee, and Edwards detailed how the pattern reflects the psychology of market participants, emphasizing its reliability when correctly identified and confirmed.
The theoretical foundation of the classic Head and Shoulders pattern is rooted in the concepts of supply and demand, as well as market psychology. The pattern represents a tug-of-war between buyers—demand—and sellers—supply. The left shoulder is formed when buyers initially push prices higher, but sellers step in to halt the rise. The head is created when buyers make a stronger effort, pushing prices to a new high, but sellers reappear, leading to a decline. The right shoulder is formed when buyers attempt one last rally but fail to reach the previous high, indicating weakening demand and the seller’s success in reversing the buyer’s advance. The neckline, which connects the lows of the shoulders, acts as a support level. A break below this line in a Head and Shoulders pattern, or above it in an inverse Head and Shoulders pattern, signals a shift of control from buyers to sellers, or vice versa.
The psychological foundation of this pattern highlights the emotions of market participants. The movement of the price from the top of the head to the low of the right shoulder indicates a shift in sentiment from bullish to bearish as buyers gradually lose confidence and sellers gain control. Conversely, the inverse Head and Shoulders pattern signals a shift in sentiment from bearish to bullish as sellers lose their grip and buyers become more assertive.
How to Trade the Head and Shoulders Chart Pattern
Learning to Identify the Head and Shoulders Pattern in Technical Analysis
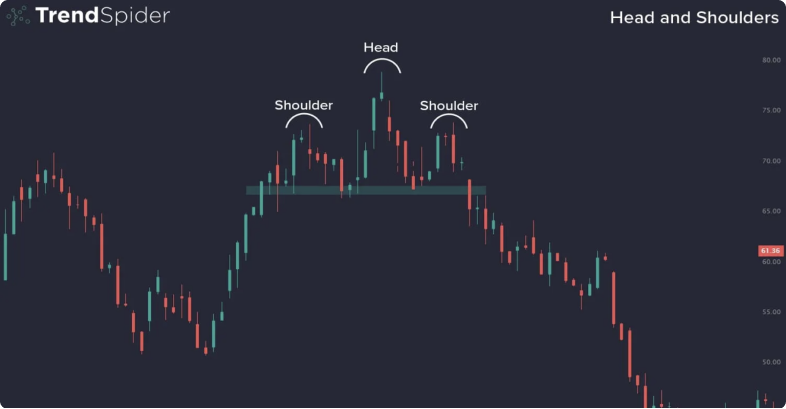
Identifying the pattern that forms the Head and Shoulders on price charts is a critically important and often profitable skill for traders across all markets, including Forex. This chart formation consists of the typical three peaks we mentioned earlier: the left shoulder, head, and right shoulder, accompanied by a neckline that acts as a level of support or resistance. To correctly identify this pattern, you should pay attention to the following elements:
Left shoulder: Formed after a significant upward move, reaching a peak before a slight drop. Volume should be relatively high during the rise and decrease during the drop.
Head: After the left shoulder, the price rises again, exceeding the previous high to form the head. This peak, also known as the head, is the highest point of the Head and Shoulders pattern. Volume should rise again during this climb but may not necessarily reach the levels seen during the formation of the left shoulder.
Right shoulder: After the head, the price drops again and then rises, forming the right shoulder. This peak is lower than the head and roughly equal to the left shoulder. The volume during the formation of the right shoulder should be lower than that during the formation of the head, indicating decreased buying pressure.
Neckline: Draw a line connecting the lows between the left shoulder and head, as well as the head and right shoulder. This line can be horizontal or sloping. The neckline serves as a key level of support in a Head and Shoulders pattern or resistance in an inverse Head and Shoulders pattern.
Identifying the Head and Shoulders pattern helps you watch for price action that breaks below or above the neckline. This breakout, followed by an increase in trading volume, confirms the pattern and signals a potential trend reversal.
The Psychology Behind the Head and Shoulders Trading Strategy
The Head and Shoulders pattern is a technical analysis formation that accurately depicts the underlying psychology and shifts in sentiment within financial markets. Understanding this psychology helps you interpret and anticipate market movements and price action.
Formation of the left and right shoulders: The initial price rise and formation of the left shoulder occur due to strong buying interest. Optimism prevails, and traders push prices higher. The formation of the right shoulder after the head indicates a weakening bullish momentum. While buyers attempt to push prices higher, they fail to reach the previous high, creating a lower peak and signaling decreasing buying pressure and increasing selling interest. Market sentiment begins to shift from bullish to bearish.
Formation of the head: The head forms when buyer interest outweighs seller pressure, and prices reach a new high. This phase reflects increased optimism and a strong belief in the continuation of the uptrend. However, as prices peak, more traders begin to sell to take profits, leading to another decline before the formation of the right shoulder and a lower peak.
Neckline and breakout: The neckline represents a crucial level of support in a standard Head and Shoulders pattern. As prices approach this level, traders closely watch for a break below the neckline. If the price breaks below, it signals that sellers have taken control, confirming the bearish reversal. In the case of an inverse Head and Shoulders pattern, a breakout above the neckline indicates a shift from bearish to bullish sentiment.
The Head and Shoulders pattern reflects the tug-of-war between buyers and sellers, capturing shifts in market sentiment and the forces of supply and demand. Traders who understand this psychology can use the pattern to predict trend reversals and make more informed decisions about buying or selling an asset. When you combine technical analysis with an understanding of market psychology, you can significantly enhance your ability to interpret price movements and improve your trading strategies.
Studying Different Trading Strategies for Trading the Head and Shoulders Pattern
To trade the Head and Shoulders pattern effectively, you need to be familiar with several strategies that you can use for both short-term and long-term moves. The key components of these strategies include identifying optimal entry and exit points, setting a stop loss and a profit target, and adapting the pattern to different trading styles, such as day trading and long-term investing.
Trading the Head and Shoulders Pattern: Entry and Exit Points
Entry point: The ideal entry point for trading the Head and Shoulders pattern is when the price breaks through the neckline after the formation of the right shoulder. This breakout confirms the pattern and signals a trend reversal. Typically, traders open a short position (or sell) in a Head and Shoulders pattern and a long position (or buy) in an inverse Head and Shoulders pattern.
Exit point: The exit point is usually determined by measuring the height from the neckline to the head and projecting this distance from the breakout point. This projection provides a target price. For example, if the distance from the neckline to the head is 10 units, the target price after the breakout will be 10 units below the neckline in a standard Head and Shoulders pattern.
Stop Loss and Target Levels
Stop Loss: Setting a stop loss is crucial for risk management. A common approach is to place the stop loss above the right shoulder in a standard Head and Shoulders pattern or below the right shoulder in an inverse Head and Shoulders pattern. This placement protects against false breakouts and limits losses.
Take Profit: As mentioned earlier, the take profit level can be set based on the height of the pattern projected from the neckline. You can also adjust take profit levels based on market conditions and other technical indicators to maximize gains.
Day Trading Strategies
Quick Breakout Strategy: Day traders often look for quick breakouts from the neckline. After confirming the breakout with increased volume, they enter a trade and aim to capture short-term price movements. The stop loss is set just above the neckline for short positions or below it for long positions. This strategy relies on quick execution and monitoring of intraday price action.
Scalping: Scalpers focus on capturing small price movements within the overall trend. They may enter and exit multiple trades throughout the day, using the Head and Shoulders pattern to determine the primary trend direction. Scalping requires tight stop losses and quick profit targets, often a fraction of the pattern’s height.
Long-Term Strategies
Swing Trading: Swing traders hold positions for several days or weeks before exiting the trade, aiming to capture larger price movements. They use the Head and Shoulders pattern to identify medium-term trend reversals. Entry and exit points are similar to day trading strategies but with wider stop loss and take profit levels to accommodate larger price swings. Swing traders may also use other technical indicators to confirm the pattern and refine their strategy.
Position Trading: Long-term investors or position traders look for significant trend reversals using the Head and Shoulders pattern. They typically enter positions after a confirmed breakout and hold them for extended periods, often months or years. Stop losses are placed farther from the entry point to account for larger market movements, and profit levels are based on long-term price projections, fundamental analysis, or other factors depending on the trader’s long-term goals.
Incorporating Technical Indicators for Trading the Head and Shoulders Pattern
Combining the Head and Shoulders pattern with other technical analysis tools can enhance prediction accuracy and provide more reliable signals. Volume indicators, moving averages, and RSI indicators can be very useful for confirming trend reversals and reinforcing confidence in the Head and Shoulders pattern. Let’s explore some of these applications:
Volume Indicators
Volume plays a crucial role in confirming the Head and Shoulders pattern. Volume indicators help traders assess the strength of the pattern and the likelihood of a successful breakout. In the image above, you can see that volume is higher during the formation of the left shoulder and the head, indicating strong buyer participation. However, during the formation of the right shoulder, volume begins to decrease, signaling a weakening buying pressure. When the breakout occurs, the reversal is confirmed by a visible spike in trading volume.
Moving Average Convergence Divergence (MACD)
MACD is a trend-following momentum indicator that shows the relationship between two moving averages of an asset’s price. It consists of the MACD line, the signal line, and a histogram representing the difference between the MACD line and the signal line.
MACD Divergence: Divergence between MACD and price can reinforce the Head and Shoulders pattern. If the price forms higher highs (the head), while MACD forms lower highs, this indicates a loss of bullish momentum, supporting the bearish reversal implied by the pattern.
MACD Crossovers: A bearish crossover, when the MACD line crosses below the signal line, can confirm a bearish breakout of the Head and Shoulders pattern. Conversely, a bullish crossover in an inverse Head and Shoulders pattern indicates strengthening bullish momentum, confirming a bullish reversal.
Relative Strength Index (RSI)
The RSI indicator is a momentum oscillator that measures the speed and change of price movements on a scale of 0 to 100. It helps identify overbought and oversold conditions.
RSI Divergence: Similar to the MACD indicator, divergence between RSI and price can provide additional confirmation. If the price forms higher highs (the head), while RSI forms lower highs, this indicates weakening bullish momentum, supporting the bearish signal of the Head and Shoulders pattern.
Overbought/Oversold Conditions: RSI can also help confirm the strength of a breakout by considering its overbought and oversold zones. In a Head and Shoulders pattern, if RSI is above 70 during the formation of the head and then drops significantly as the price breaks the neckline, this confirms the bearish reversal. In an inverse Head and Shoulders pattern, if RSI rises from oversold below 30 and moves higher during the breakout, this confirms the bullish reversal.
Combining Indicators for Greater Accuracy
Volume and RSI: Combining volume and RSI provides a comprehensive view of market sentiment. Decreasing volume on the right shoulder and RSI divergence, with lower highs, can strongly confirm a bearish breakout.
MACD and OBV: Using MACD and OBV together can confirm the strength of a trend reversal. If MACD shows a bearish crossover and OBV does not support higher highs, the bearish signal of the Head and Shoulders pattern is reinforced.
Multiple Confirmations: For greater accuracy, you can look for multiple confirmations across different indicators. For example, a Head and Shoulders pattern confirmed by increased volume at the breakout, MACD divergence, and RSI moving from overbought to neutral can provide a strong trading signal.
To avoid errors and pitfalls, remember that some traders often misinterpret the Head and Shoulders pattern by identifying it prematurely or inaccurately, leading to false signals and poor entries. Do not neglect the power of indicators like volume and MACD to confirm the pattern before acting. Additionally, many traders fail to place stop-loss orders properly, increasing their exposure to risk. To avoid these mistakes, ensure the pattern is fully formed, confirm its strength with volume and other indicators, and use a stop loss slightly above the right shoulder for short positions. Effective risk management strategies include using position sizing, setting profit targets, and diversifying trades to mitigate losses.
Trading the Reversal Head and Shoulders Pattern on the Hourly CAD/JPY Chart
The 1-hour CAD/JPY chart illustrates a classic Head and Shoulders trade. Here’s an analysis of why it was successful in predicting the next downward trend and how you could have profited from it:
Pattern identification:
Left shoulder: The left shoulder forms when the price reaches a peak and then pulls back. On this chart, it is clear where the price peaked and then dropped.
Head: The head is the highest point of the pattern, where the price rises above the left shoulder and then drops again.
Right shoulder: The right shoulder forms after the head, with the price rising again but failing to reach the height of the head, signaling weakening momentum.
Setting the neckline:
The neckline is drawn by connecting the lows of the pullbacks from the left shoulder and head. This support line is crucial, as it indicates where a breakout will confirm the pattern.
Breakout confirmation:
The pattern is confirmed when the price breaks below the neckline. In this example, the price clearly drops below the neckline, signaling a strong bearish trend.
Executing the trade:
Entry point: A trader would enter a short position as soon as the candle closes below the neckline. This breakout indicates that the trend reversal is likely to continue.
Stop Loss Placement: To manage risk, the stop loss should be placed just above the highest point of the right shoulder. This helps protect against false breakouts or unexpected price movements.
Profit Target: The expected price move can be estimated by measuring the distance from the head to the neckline and projecting that distance down from the neckline.
The clear formation of this pattern and the subsequent price action make it a great example of how the Head and Shoulders trading pattern can be used to predict market movements and improve trading decisions. Proper identification, confirmation, and risk management are key components to using the Inverse Head and Shoulders pattern effectively.
Conclusion
The Head and Shoulders pattern remains a valuable tool for traders looking to spot potential market reversals. Its distinctive shape provides a clear visual cue that can help traders anticipate and react to market moves. Understanding and effectively applying this pattern can improve your trading strategies and allow you to make more accurate bets in both bull and bear markets. However, like all technical analysis tools, it should be used in conjunction with other indicators and within the broader context of market trends and economic factors. As algorithmic trading continues to evolve, its impact on traditional patterns such as Head and Shoulders must be considered. Algorithmic systems, with their ability to process massive amounts of data and execute trades at lightning speed, can impact the emergence and reliability of such patterns. While these patterns may still be relevant, traders must remain vigilant and adaptive, ensuring that their strategies take into account the changing dynamics introduced by automated trading systems and machine learning. Using a combination of traditional and modern trading methods will be critical to navigating the complexities of modern financial markets.
For further understanding of the Head and Shoulders pattern, I highly recommend the ULTIMATE Head And Shoulders Pattern Trading Course (PRICE ACTION MASTERY) on YouTube by Wysetrade. This video provides comprehensive information on the pattern, including several examples and strategies for incorporating it into your trading toolbox. Continuous learning and constantly updating educational resources are essential to sharpening your trading skills and adapting to the market landscape.