What Is the Dark Cloud Cover Pattern?
Candlestick analysis models are known for their simplicity and accessibility, making them ideal for beginners. These models effectively predict market movements using just 1-3 chart elements. Reversal patterns are particularly valuable as they allow traders to enter the market at the beginning of a new trend. In this material, we will describe the Dark Cloud Cover pattern and provide examples of signals on the chart.
The Dark Cloud Cover is a candlestick pattern indicating a bearish reversal. It occurs when a downward-moving candle (usually colored black or red, referred to as a bearish candlestick) opens higher than the previous upward-moving candle’s (typically white or green, referred to as a white candle) close, but closes beneath the midpoint of the first candle. This pattern occurs at the end of an uptrend, signifying a momentum shift from rising to falling. Formed by a sequence of an upward first candle followed by a downward second candle, traders anticipate the price to further decrease with the subsequent (third) candle, seeking this as a confirmation of bearish reversal pattern.
Key Takeaways:
- Momentum Shift: The Dark Cloud Cover is a candlestick pattern that indicates a shift in market momentum towards the downside after a period of price increases.
- Pattern Composition: This pattern consists of a bearish candle that opens above the close of the preceding bullish candle but closes below the midpoint of that bullish candle.
- Significance of Candle Size: Both candles should be relatively large, demonstrating significant involvement by traders and investors. Smaller candles may diminish the pattern’s significance.
- Confirmation: Traders usually look for confirmation of the pattern through further price declines in the following candle. This continued drop confirms the bearish reversal signaled by the Dark Cloud Cover.
Dark Cloud Cover as a Bearish Reversal Indicator
The Dark Cloud Cover pattern is recognized by a significant black candle that forms a “dark cloud” over an earlier upward-moving candle, signaling a shift from a bullish to a bearish market sentiment. This pattern typically appears after an uptrend, suggesting a potential reversal as buyers initially drive prices up at the opening, but sellers dominate by session’s end, causing a substantial decline. It is most relevant when following a clear uptrend, as its predictive value diminishes in choppy markets where ongoing volatility is expected to persist.
To validate the Dark Cloud Cover, five specific criteria must be met: an existing bullish trend, a bullish candle during this trend, a gap up the next day which turns into a bearish candle, and this bearish candle must close below the midpoint of the previous bullish candle. These candles often display long real bodies with minimal shadows, emphasizing a decisive bearish move. Confirmation from a subsequent bearish candle, suggesting further declines, is ideal for reinforcing the pattern’s reliability. Traders might use this pattern alongside other technical tools, such as the RSI or support level breakdowns, to enhance their trading strategies.
Trading the Dark Cloud Cover Pattern
Let’s explore how to trade using the Dark Cloud Cover pattern. This pattern is used for selling, and we’ll apply it for intraday trading.
- Choosing the Chart: Open a candlestick chart of any currency pair in an uptrend. If yoo are day trading, choose a smaller time frame, such as 1 hour.
- Identifying the Pattern: Wait for the Dark Cloud Cover pattern to appear. For intraday trading, it’s important that the closing prices of the light and dark candles are usually the same.
Signals that strengthen the pattern:
- Significant overlap of the dark candle’s body over the light candle’s body.
- Both candles in the pattern have long bodies and no shadows (known as “black day with shaved top/bottom”).
- Increased trading volume on the second candle.
- A gap down or a bearish candle following the pattern.
- Opening a Position: Once the pattern forms, open a sell position with the next candle.
- Setting Stop-Loss: Place the stop-loss slightly above the pattern.
- Setting Take-Profit: Place the take-profit slightly above the recent local minimum, use a trailing stop, or set it at an important level.
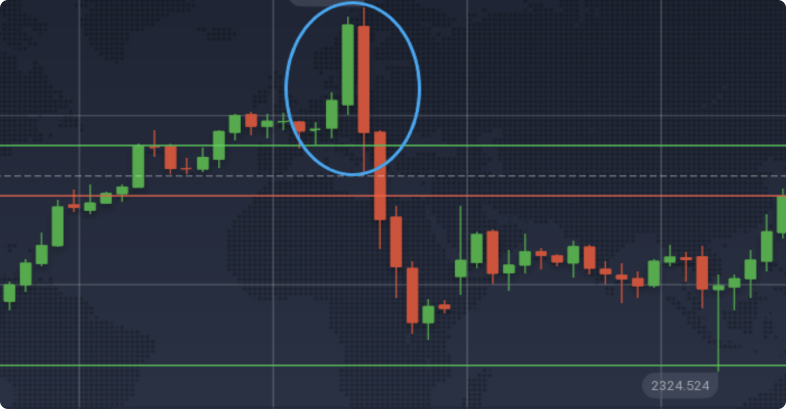
An example of a sell trade is shown below on Gold 1H Chart.
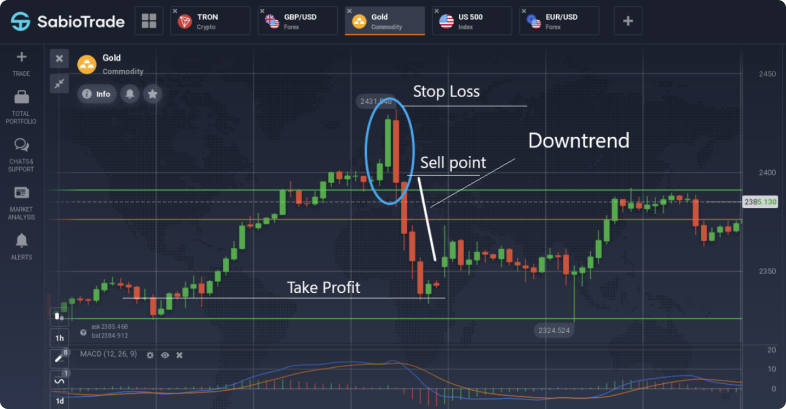
Gold 1H Chart
In our example with gold, we used the MACD, which, as seen, is in the overbought zone, confirming the start of a downward price movement. Other indicators like RSI and Volume can also be used, but avoid adding them all at once (a common rookie mistake). One is sufficient; otherwise, it can lead to confusion.
Opposite Pattern: The Piercing Lin
The Piercing Line pattern is essentially the opposite of the Dark Cloud Cover pattern. It appears at market lows during a downtrend and consists of a white and a black candlestick.
In a descending trend, a strong red candlestick forms, hitting new local lows. During the next trading session, the market opens with a gap downwards due to continued selling pressure. However, the market then starts to recover, closing with a strong green candlestick that closes within or above the middle of the red candlestick’s body.
This indicates that the bears failed to maintain the new lows and the bulls are ready to take over, potentially leading to a correction or even a trend reversal.
The higher the green candlestick closes, the stronger the buy signal. Once this pattern appears, a price movement above the high of the green candlestick is a signal to buy. However, if the price falls below the low of the pattern, the signal is cancelled.
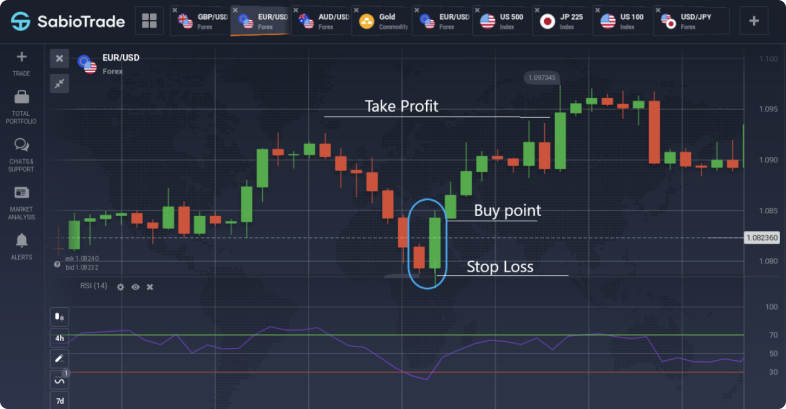
EUR/USD 4H Graph
In the example of the EUR/USD chart, we demonstrated that it is possible to use not only 1H timeframes but also higher ones, such as 4H. An additional indicator used is the RSI, which strengthened the signal by being in the overbought zone.
Features of Working with the Dark Cloud Cover Pattern
Candlestick patterns are quite effective on their own, but their efficiency can be further improved by considering a few important aspects when working with the Dark Cloud Cover pattern. Here are some key points to keep in mind:
- Timeframes: The Dark Cloud Cover pattern is most effective on larger timeframes. While it can be used on the H4 timeframe, its success rate is generally lower. Therefore, it’s better to focus on daily periods and above.
- Confirmation with Indicators: If the candlestick pattern is accompanied by additional signals from indicators on a smaller timeframe, the probability of a reversal increases.
- Reversal Zones: Reversal areas often act as catalysts for pattern formation. Mark major support and resistance levels. If a Dark Cloud Cover forms, the subsequent candles are likely to be bearish.
- Trading Strategy: To trade this pattern successfully, remember the key relationships and the position opening algorithm. Managing the trade involves setting a stop-loss and take-profit. Even if the pattern doesn’t work out as expected, over time, there will be more profitable signals. Considering the take-profit to stop-loss ratio, this creates an effective trading model. By following these recommendations, you can achieve good results.
Conclusion
The Dark Cloud Cover pattern is a valuable tool for traders looking to identify bearish reversals in the market. Here’s a quick summary of the key points:
- Trading the Dark Cloud Cover: To effectively trade using the Dark Cloud Cover pattern, traders should first correctly identify the pattern, distinguishing it from similar formations like bearish engulfing or shooting star patterns. Once identified, it’s crucial to wait for confirmation before making a selling decision. While the pattern indicates a bearish reversal, it doesn’t always mean a long-term decline, as stock prices may recover in the following days or weeks, especially for long-term investors.
- Opposite Pattern: The opposite of the Dark Cloud Cover is the Piercing Line pattern. This bullish reversal pattern features two candlesticks, with a down candle followed by an up candle, indicating a potential increase in stock prices.
- Understanding the Pattern: The Dark Cloud Cover pattern signals a reversal from a bullish uptrend to a bearish downtrend, causing a sudden decrease in stock prices after a period of rising. Recognizing and understanding this pattern can help traders make informed decisions during market shifts.
By incorporating these insights and strategies, traders can enhance their ability to navigate market trends and make more informed trading decisions.