25 Popular Candlestick Patterns Every Trader Should Know


Since being assembled by Munehisa Homma, an expert rice trader from Japan, in the 1700s candlesticks have become a part of the fundamentals of chart analysis in evaluating the action behind prices and the dominant forces driving the market.
Candlestick patterns have become a universal language throughout Forex, stock markets, crypto, and futures, giving market participants insights into dominant emotions and feelings behind price movements, trend analysis, trend reversals, who is in control of the market, and overall predictions on future price behavior.
Candlesticks are powerful tools. They imprint a history of what happened to prices within a specific timeframe, registering the results of the clash between buyers and sellers. By analyzing candlesticks, you can identify the most dominant force and gain insights into momentum and strength.
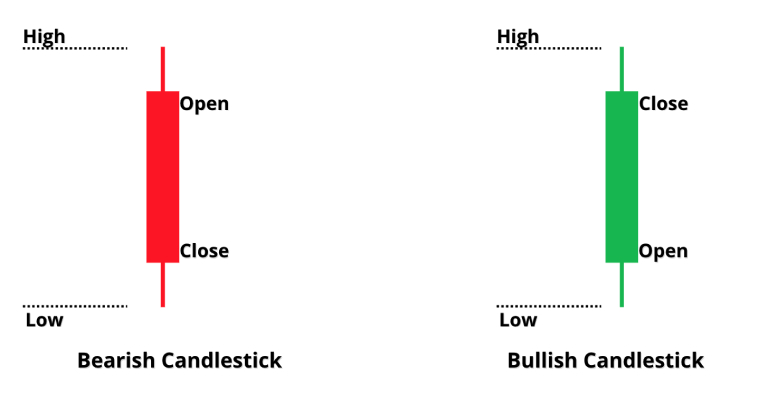
Technical analysts study candlestick patterns to predict the direction of price behavior. However, before exploring how chart patterns help traders find opportunities in candlestick charts, we first have to become familiar with its most basic structure:
It is important to consider that a candle’s timeframe affects its formation and interpretation. Shorter timeframes (i.e., 30 minutes or 1 hour) capture intraday movements. Longer timeframes, such as daily, weekly, or monthly, capture a larger context of momentum and market trends.
Candlestick trading tends to be more effective when considering the overall context, such as trend direction, volume for validating patterns, plus confluence when integrated with other technical instruments.
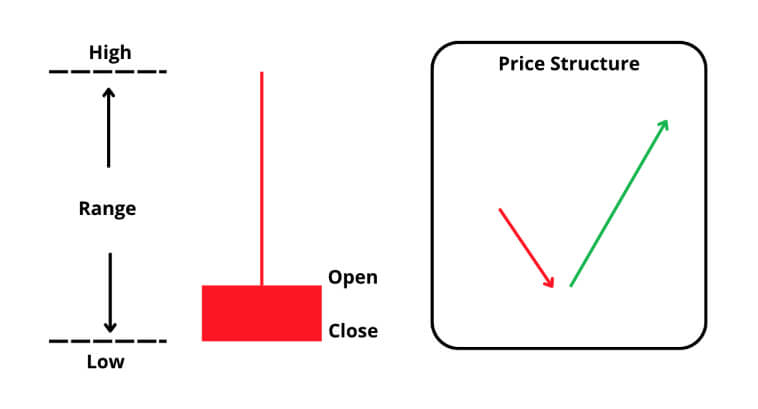
This bullish pattern is identified by a lone candlestick formed by a tiny body near the top and a long shadow below it. It reflects a surge in demand within a downward slope, usually when prices reach a state of oversold marks.
Studies vary on measuring the Hammer candlestick pattern’s success rates, but it tends to correctly identify trend reversals about half the time.

One of the most common candlestick patterns, the Inverted Hammer, comes with a small body and an extended wick above it, appearing at the lowest point of a downward run. It reflects that, although sellers drove the price to lower levels, the buy-side players started to show higher enthusiasm for the asset at its current level, implying that bulls are ready to take the price back up.
Studies suggest a win rate of around 60-70%, with its effectiveness increasing when a bullish candle appears right after it.
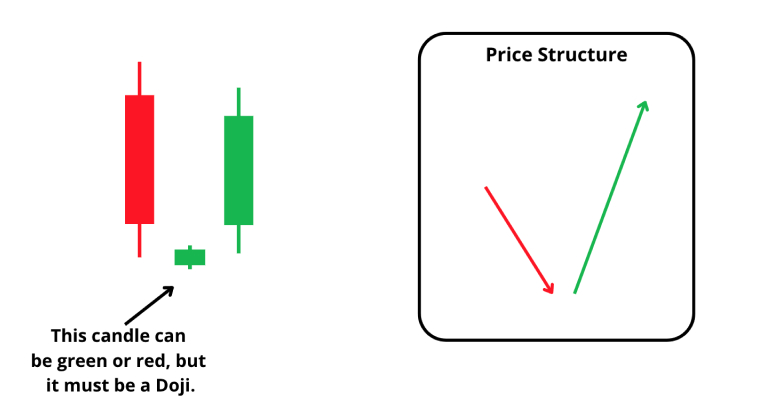
The candlestick formation known as Morning Star is a candle pattern represented by a trio of candles: the first candle is a lengthy, bearish candlestick. The second candlestick is a tinier candle pointing out to equilibrium among buying and selling forces, with a notable green candle marking that bulls have overpowered the sell-side at current levels. This is a strong bullish signal, which incites many traders to take long positions at the closure of the third candle.
Studies suggest an effectiveness rate ranging from 50-75% when taking the entire context of the market into account. The offs of forecasting a trend reversal rise when a boost in volume confirms the pattern.
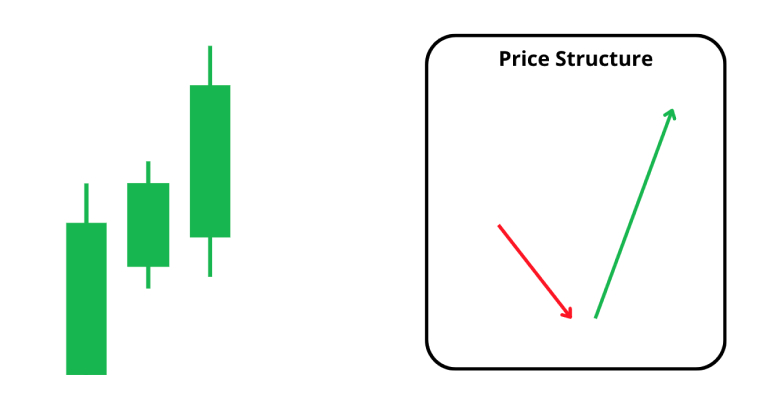
This pattern is identified by three bullish candlesticks forming at the lowest point of a bearish price trend. Each candle opens within the range of its predecessor, and each closing price is higher than the one before it. This pattern displays an extremely strong shift from bearish to bullish sentiment.
Studies indicate that this pattern might have a success rate of around 60-80%, especially in cases where it appears after a prolonged bearish market.
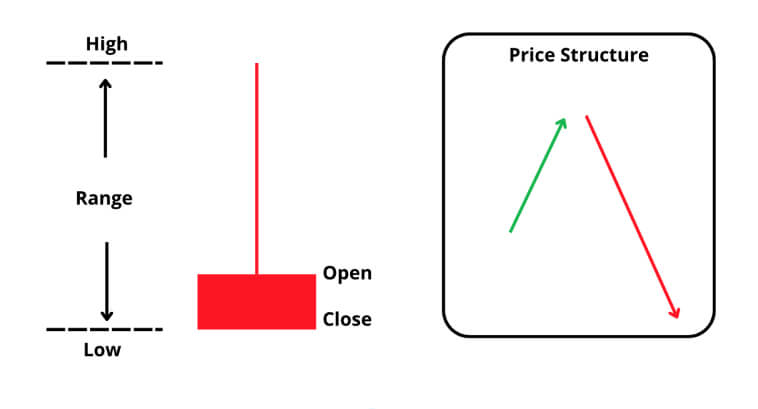
This single-candlestick figure features a tiny body close to the base and featuring a lengthy shadow above it. Although it looks identical to the inverse hammer figure, it occurs at the peak of a bull market, hinting at exhaustion and growth of sell-off pressure.
Studies indicate a success rate of around 50-65%. A volume larger than average plus a large-bodied red candlestick in the coming session adds confidence to the figure.
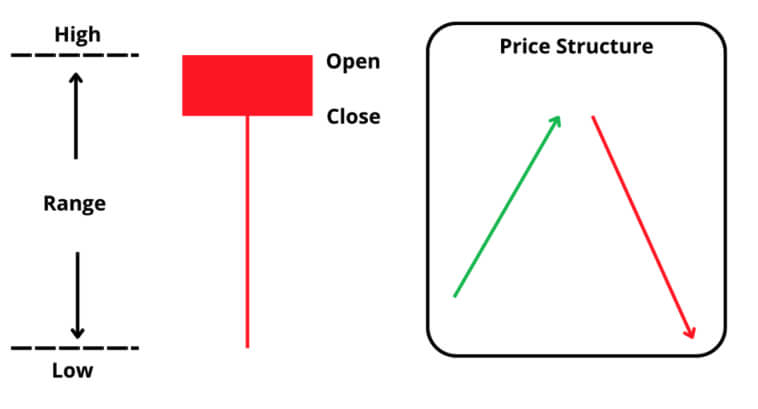
The Hanging Man figure is very similar to the Hammer, but it also appears at the end of an uptrend. It imprints the surge of selling pressure right at the exhaustion point of an uptrend, indicating that sellers are about to push the price lower.
Studies indicate a success rate of somewhere between 60-70%, with its effectiveness increasing when followed by a bearish candle.
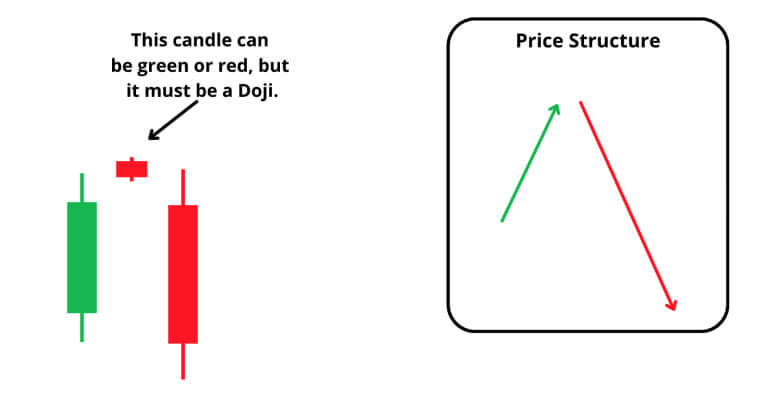
The Evening Star setup is the counterpart of the Morning Star pattern, reflecting a struggle between buyers and sellers at a crucial point of an uptrend, with bears winning over bulls.
It is a formation made of a triplet of candles. It first starts with a lengthy bullish candle, a small middle candle pointing to a tight fight between buy-side and sell-side players, followed by a strong bearish candlestick that highlights the overpowering of the seller pressure over the buying pressure.
This pattern has a high reliability rate, about 70% according to some sources.
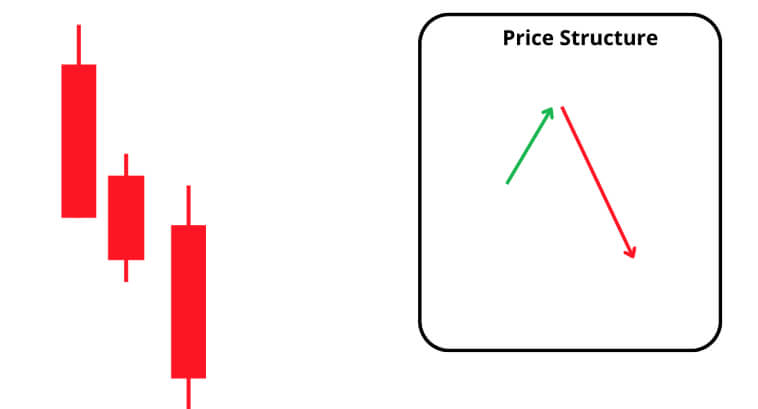
This pattern is the counterpart of the Three White Soldiers. It happens at the peak of an uptrend and is characterized by three successive bearish candlesticks that close incrementally lower. This behavior also points out a strong transition from a buy-side momentum to a sell-side momentum in the market.
This pattern can have a high effective rate, with studies indicating it may correctly predict bearish reversals around 75-85% of the time.
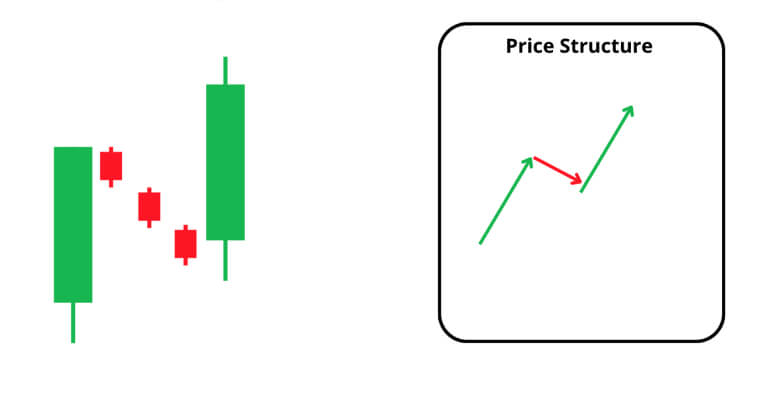
Formed by five candlesticks, this pattern initiates with a bullish candle, followed by three minor bearish candles staying within its range, plus one last bull candle that reaches a new high.
This pattern reflects a profit-taking mid-trend. The smaller bearish candles highlight weak selling pressure, which is overpowered by the surge in demand that appears in the fifth candle.
Its success rate is highly dependent on market conditions, such as the intensity of the upward trend and transaction volume. Some studies suggest that, under the right circumstances, this pattern can reach an accuracy level of around 75-80%.
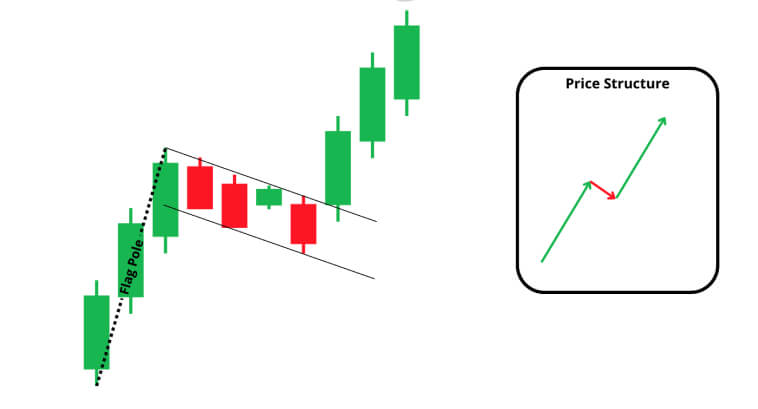
This Bullish Flag candlestick pattern is characterized by a dominant bullish push that is referred to as the flagpole, trailed by a small descending price consolidation that resembles a flag, and then a breakout upward.
It indicates strong buying pressure and the continuation of the buy-side strength with a brief pause for profit-taking.
Some studies indicate that the accuracy level of the Bullish Flag Pattern stands at 60-70%.
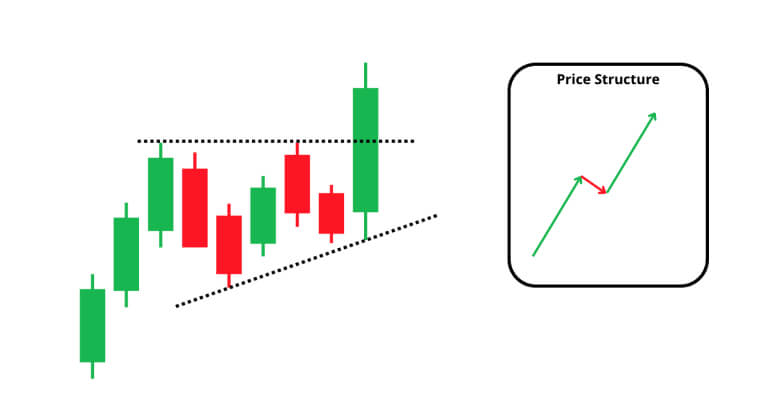
This is a multiple candlestick pattern where the price forms higher lows while the highs encounter a brief resistance point, creating a triangle shape. When a breakout above the resistance line happens, we have a confirmation of the pattern.
Psychologically speaking, this candlestick pattern implies that bears are “testing the waters” to push prices down, but they are not capable of winning over the buy-side pressure.
Studies indicate that the ascending triangle pattern might reach an effectiveness rate of 65-75%.
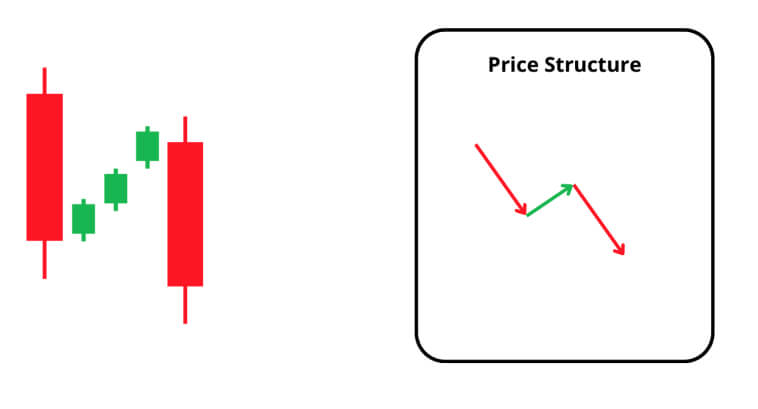
The Falling Three Methods is a three-candlestick formation that points out the continuation of a bearish momentum. It indicates profit-taking and a brief pause before buy-side pressure is overpowered by a stronger sell-side force.
Studies indicate that this pattern can reach a success percentage of 65-75%.
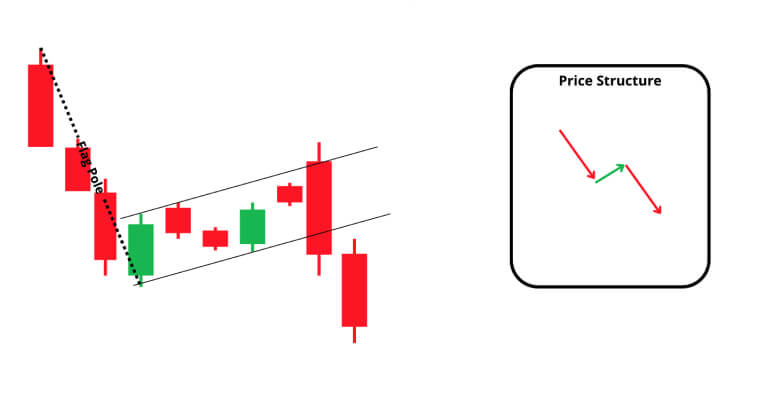
This pattern is the inverted form of the Bullish Flag Pattern. It also has a flagpole, but the flag is formed by an ascending consolidation movement that is followed by a breakdown, confirming the advancement of prices toward lower levels.
In market dynamics, it represents a brief pause for profit-taking before the breakdown suggests that the downtrend will resume.
Some studies say that the confidence levels of this pattern stand at around 65-75%.
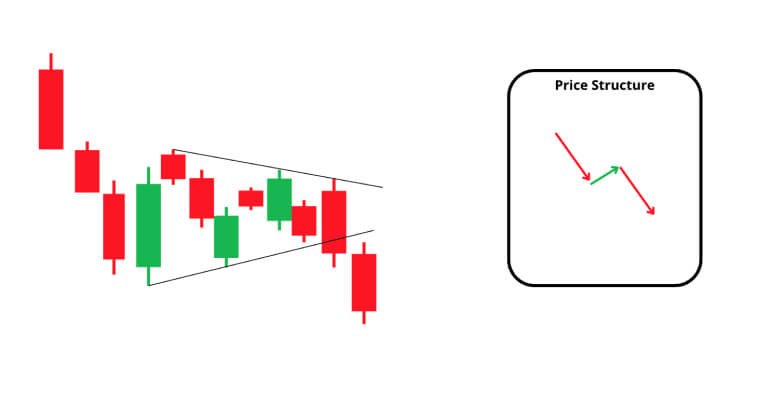
This pattern is formed by a sharp bearish price action followed by a symmetrical consolidation that resembles a pennant or a triangle. A downward breakdown confirms the pattern and the continuation of the bearish strength, driving prices down.
It represents a very short pause in the current downtrend, where prices consolidate briefly before bears regain control over the direction.
Sources indicate that this pattern has a confidence score of around 50-60%.
Although some candlestick formations suggest a strong dominance of one party over the other, some other patterns indicate a point of equilibrium where none of the bullish or bearish forces were able to overpower the other, further reflecting indecision in the market.
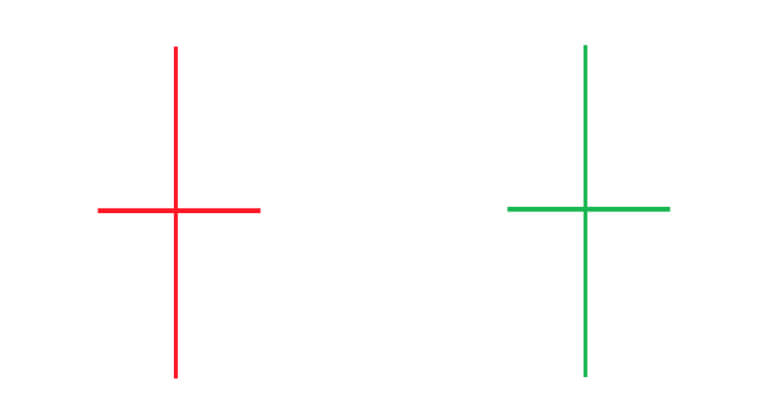
The Doji is a single candle where the opening and closing prices are almost the same. Its shape resembles a cross.
Market indecision figures can either precede reversals or even serve as a trend continuation pattern–the interpretation depends on the overall context. When it appears close to a resistance or support level, it can signal a reversal. When it appears around moving averages during a strong trend, it can represent a pause before continuation.
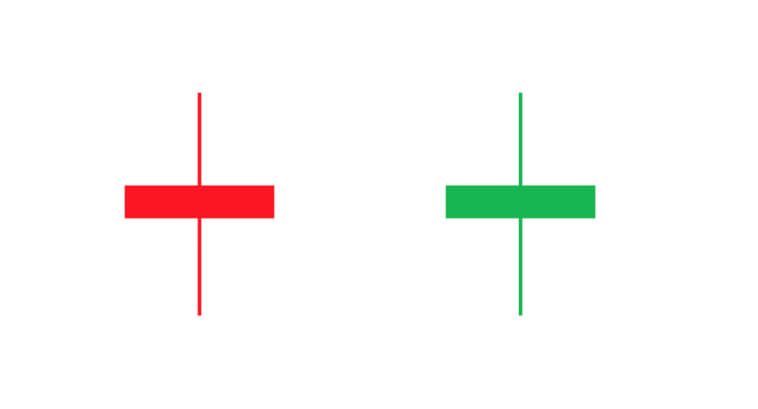
The Spinning Top candlestick pattern works very similarly to the Doji pattern, but it has a small body within its shadows, so it doesn’t have a cross-like shape as strong as the Doji.
The Spinning Top can also be interpreted as a continuation or reversal pattern depending on the context in which it appears. The rules are similar to that of the Doji. It can indicate reversals when appearing in key support and resistance points or a brief moment of consolation before the trend continues when it appears around moving averages.
A High Weave Candlestick resembles a Spinning Top, but it has exceptionally long shadows. It also reflects uncertainty, and its definition as a continuation or reversal pattern differs according to where it appears on the chart.
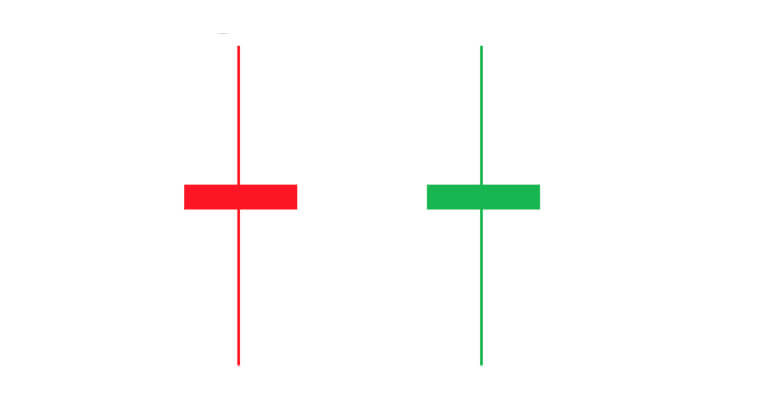
Given the nature of uncertainty candlestick patterns, it can be quite difficult for traders to interpret their meaning. To enhance your chances of accurately interpreting them and using them to predict price movements, try applying additional indicators to your trading system. You can draw support and resistance levels on the chart, as Dojis and Spinning Tops around these levels can be quite accurate in identifying trading reversals, especially with a spike in volume.
Moving averages and trendlines can help you contextualize the direction. When these uncertainty patterns appear around a moving average, this can be a signal of trend continuation, especially when followed by a longer candle in the direction of the main trend and a surge in volume.
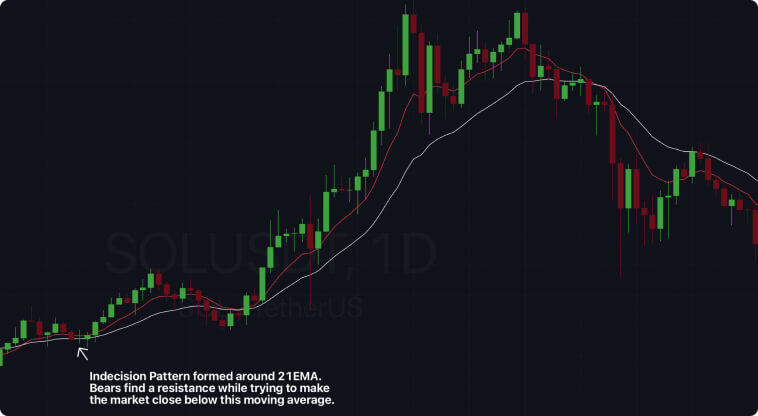
In the example below, we can see an indecision candlestick, similar to a Doji, forming around the 21-day exponential moving average. This moving average is working as a support level for prices in the image since bears are struggling to push prices below it.
Candlestick patterns have become an indispensable part of technical analysis in modern times. They are easy to interpret and provide quick visual information on market direction, momentum, strength, indecision, etc.
Candlesticks offer a rich amount of patterns and figures to help you identify trend reversals, continuations, and uncertainty. Even though these patterns do say a lot on their own, they shouldn’t be used in isolation for trading in the market. Introducing additional techniques when building a trading strategy, using trend lines, moving averages, and support and resistance levels can give a lot of insights into whether a candle formation is an indicator of trend reversal or trend continuation.
Even though reliability rates can vary depending on the study, market conditions, and over time, the patterns listed down below are still valuable in 2024 and can be extremely beneficial additions to your trading system.
| Pattern | Type | Success Rate (%) | Description |
| Hammer | Bullish Reversal | ~50 | A single candle with a small body and long lower shadow. It indicates a reversal after a downtrend, especially in oversold conditions. |
| Inverted Hammer | Bullish Reversal | ~60-70 | Appears at the bottom of a downtrend with a small body and long upper shadow. |
| Morning Star | Bullish Reversal | ~50-75 | A three-candle pattern indicating a reversal. It involves a bearish candle, a smaller indecision candle, and a bullish candle. |
| Three White Soldiers | Bullish Reversal | ~60-80 | Three consecutive bullish candles indicating a strong shift from bearish to bullish sentiment. |
| Shooting Star | Bearish Reversal | ~50-65 | Single candle with a small body and long upper shadow. It indicates bearish reversal at the peak of an uptrend. |
| Hanging Man | Bearish Reversal | ~60-70 | Similar to a Hammer but appears at the top of an uptrend and indicates bearish reversal. |
| Evening Star | Bearish Reversal | ~70 | Counterpart to Morning Star; a three-candle pattern indicating a bearish reversal at the top of an uptrend. |
| Three Black Crows | Bearish Reversal | ~75-85 | Three consecutive bearish candles indicating a shift from bullish to bearish sentiment. |
| Rising Three Methods | Bullish Continuation | ~75-80 | Bullish candle, followed by three smaller bearish candles within its range, and another bullish candle. |
| Bullish Flag | Bullish Continuation | ~60-70 | Strong upward movement (flagpole), followed by a consolidation and breakout upward. |
| Ascending Triangle | Bullish Continuation | ~65-75 | Price forms higher lows and consolidates against resistance. A breakout above resistance confirms the pattern. |
| Falling Three Methods | Bearish Continuation | ~65-75 | Bearish candle, followed by three smaller bullish candles within its range, and another bearish candle. |
| Bearish Flag | Bearish Continuation | ~65-75 | Downward movement (flagpole), followed by an ascending consolidation and breakout downward. |
| Bearish Pennant | Bearish Continuation | ~50-60 | Sharp bearish move, brief symmetrical consolidation, and continuation downward. |
| Doji | Uncertainty | Context-dependent | Indicates market indecision; context such as support/resistance levels or trendlines determines whether it signals reversal or continuation. |
| Spinning Top | Uncertainty | Context-dependent | Small body with longer shadows; reflects indecision and can signal reversals or continuation depending on its location on the chart. |
| High Wave Candle | Uncertainty | Context-dependent | Similar to Spinning Top but with exceptionally long shadows; indicates heightened market uncertainty. |