Bear Flag Pattern: Easy To Trade
The bear flag is a bearish chart pattern used in technical analysis that signals a potential continuation of a downward trend after a short period of consolidation. This pattern, essential for use of the bear flag, is formed by a sharp decline in prices, known as the “flagpole,” followed by a slower, sideways price movement confined within two parallel trend lines—the “flag.” These lines act as support and resistance, giving the pattern its characteristic appearance, reminiscent of a flag on a flagpole.
Identifying a bear flag is crucial for traders who look for bearish continuation patterns, especially in day trading and different trading strategies focused on trend continuation. The pattern is completed once the price breaks below the lower boundary of the flag, which could invalidate the bear continuation formations if the price does not continue to drop. Successful trading of the bear flag involves recognizing this bearish chart pattern that signals the likely resumption of the initial downward trend. Traders use this pattern to determine optimal entry and exit points, thereby enhancing the effectiveness of their trading strategy. This bear retracement patterns trading strategy can help traders maximize their ability to capitalize on bearish market movements, making it a popular tool in the arsenal of pattern trading.
How to Identify a Bear Flag Pattern
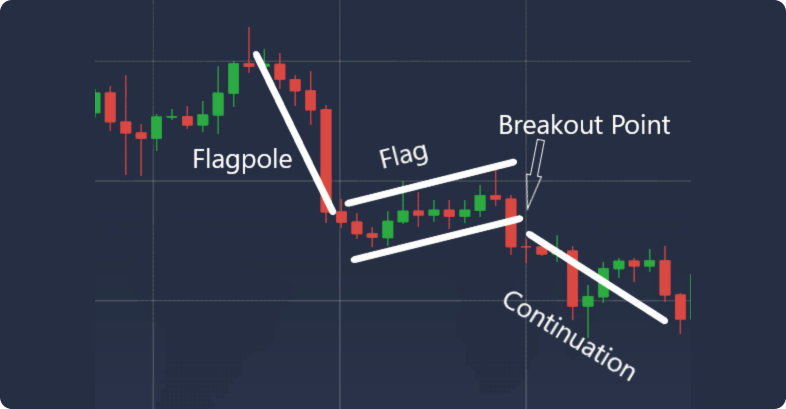
The “Flag” chart pattern consists of four separate parts:
-
- Flagpole: A strong and relatively sharp price movement in one direction.
- Flag: A consolidation period that follows the initial price movement.
- Breakout Point: The point at which the chart exits the pattern, i.e., the price breaks above or below the flag.
- Continuation: The continuation of the initial price movement.
Factors Affecting the Reliability of the “Bear Flag” Pattern in Trading
The “bear flag” pattern is a technical analysis tool used in trading that can signal the continuation of a bearish trend. Several factors can influence its reliability, and traders should consider these before trade the bear frectangular formations:
- Volume: Volume plays a pivotal role in confirming the reliability of the bear flag pattern. A bear flag with robust volume during its formation is generally more dependable than one with low volume, as high volume suggests strong market participation and supports the continuation of the bearish trend.
- Pattern Duration: The length of time the bear flag takes to form also affects its credibility. A very short bear flag might not allow enough time for proper market consolidation, potentially leading to a failed bear flag. Conversely, a bear flag that extends too long might suggest a weakening of the bearish momentum and the possibility of a market reversal.
- Market Context: The overall market environment is crucial when assessing a bear flag pattern. A bear flag that develops during a strong downtrend is typically more reliable than one that forms in a less defined trend. Traders should also integrate other technical indicators to validate the bear price consolidation formations, looking for additional signs that support the likelihood of a bearish continuation.
For effective trading, it is advisable to use bear flag trading strategies that combine both technical and fundamental analysis. Identifying a bear flag involves recognizing the flag pole (the initial sharp price drop), the flag (consolidation phase), the breakout point (where prices break lower from the flag), and the continuation (where the downtrend resumes). Setting strategic entry and exit points based on these elements can help manage risks, especially by placing stop-loss orders to protect against potential market reversals.
How to Use the Bear Flag Pattern
If you spot a this pattern on a chart, it’s usually recommended to wait a bit after the initial breakout before opening a trade. This approach helps avoid false signals that might occur.
Additionally, it’s important not to rely solely on patterns when analyzing the market. It’s more effective to use them in conjunction with other technical analysis tools to enhance the accuracy of your signals. For example, incorporating moving averages, the Relative Strength Index (RSI), or Bollinger Bands can provide additional confirmation of the signals derived from the flag pattern.
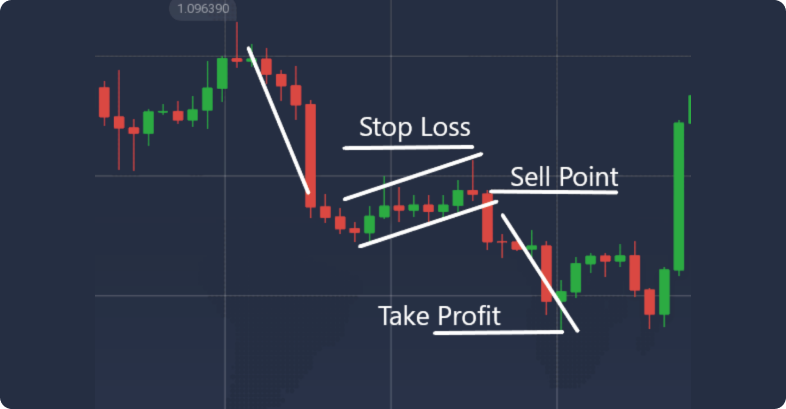
When trading bear flags, traders typically look to open a sell position when the price exits the consolidation period and re-enters a downward trend. Similar to trading bull flags, take-profit orders are generally set at a distance equal to the initial flagpole or the price difference between the support and resistance levels. A stop-loss is often placed at the level of the upper trend line or slightly above it.
In addition to learning about the bear flag, you can check out best forex trading strategies that will help improve your trading plan.
When you spot a bear flag pattern on a chart, it’s usually recommended to wait a bit after the initial breakout before opening a trade. This approach helps avoid false signals that might occur.
Entry Points
- Wait for Confirmation: After identifying a bear flag pattern, wait for the price to break below the lower trendline of the flag. This breakout confirms the continuation of the downtrend.
- Avoid Immediate Entries: Don’t rush to enter a trade immediately after the breakout. Waiting for a retest of the broken trendline can provide a more reliable entry point and help confirm the breakout.
Exit Points
- Take-Profit Orders: When trading bear flags, set take-profit orders at a distance equal to the height of the initial flagpole or the price difference between the support and resistance levels of the flag. This distance provides a target for potential price movement following the breakout.
- Multiple Targets: Consider setting multiple take-profit levels to secure gains incrementally as the price moves in your favor.
Stop-Loss
- Setting Stop-Loss: Place a stop-loss order at the level of the upper trendline of the flag or slightly above it. This helps limit potential losses if the price reverses and invalidates the bear flag pattern.
- Trailing Stop-Loss: As the trade moves in your favor, adjust the stop-loss to lock in profits while allowing room for the trend to continue.
Additional Considerations
- Combine with Other Indicators: It’s important not to rely solely on patterns when analyzing the market. Use the bear flag pattern in conjunction with other technical analysis tools to enhance the accuracy of your signals. For example, incorporating moving averages, the Relative Strength Index (RSI), or Bollinger Bands can provide additional confirmation of the signals derived from the flag pattern.
- Market Conditions: Consider the overall market conditions and the context in which the bear flag pattern is forming. Strong bearish sentiment in the market can increase the reliability of the pattern.
Bear Flag vs. Bull Flag
Bull and bear flags are two distinct continuation patterns frequently seen in the cryptocurrency market. Although they share structural similarities, these patterns have pivotal differences that determine their predictive outcomes.
A bull flag, known as a bullish flag, indicates the resumption of an upward market trend after a brief consolidation period. This chart pattern signals that buyer activity is ramping up, likely resulting in an upward surge in the market. Conversely, a bear flag—recognized as a bearish chart pattern—signals the continuation of a market downturn, where sellers regain control, potentially leading to further declines.
Each pattern provides crucial entry and exit points for trading, and their slopes offer insights into market equilibrium before the trend continues. The bear flag, particularly noted for its technical analysis significance, typically has the flag portion of the pattern tilted upward, suggesting an ongoing bearish sentiment. This pattern is completed when the price breaks below the lower boundary of the flag, potentially invalidating the bear flag if it fails to continue downward.
In the context of day trading or different trading plans:
-
Bull flag:
- Forms an ascending trend as the flag pole.
- The flag portion is tilted downward.
- Indicates a potential upward price movement post-consolidation.
- Often paired with bullish trades.
-
Bear flag:
- Indicates a descending trend with its flag pole.
- Flag portion tilts upward.
- Continuation of a bearish trend is expected.
- Essential for strategies that look for bearish continuation patterns.
Understanding these nuances assists traders in identifying whether they are seeing a bullish or bearish flag and adjusting their strategies accordingly. By integrating these patterns with other analytical tools, traders can enhance their ability to forecast market movements and improve their trading outcomes. This pattern trading, for example, emphasizes recognizing the bear flag as a technical pattern that signals the likelihood of continuing downward trends, which is crucial for setting strategic trades.
For a deeper understanding of flag patterns and their use in swing trading, we recommend reading the article Exposing Swing Trading: A Comprehensive Approach to Strategies and Fundamentals.
Different Types of Bear Flag Patterns
The “bear flag” pattern includes several variations that traders can leverage to spot profitable trading opportunities. Below are two common types of patterns and guidelines on how to trade them:
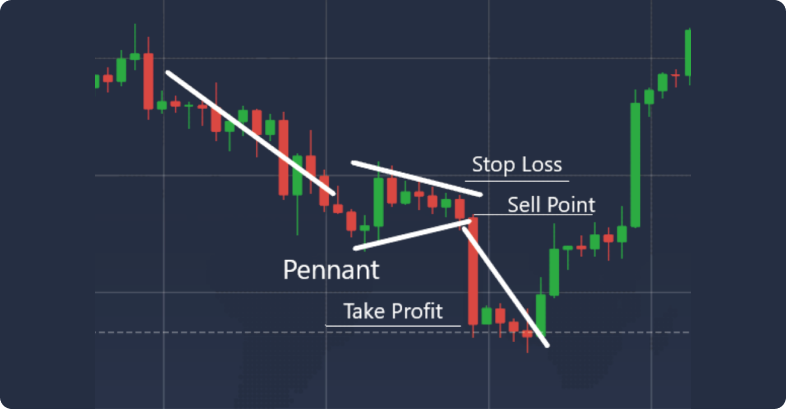
Bear Pennants
Bear pennants are a specific version of the bear flag. They appear when the flag resembles a symmetrical triangle. The sharp decrease in price forms the flagpole, and the pennant represents a period of consolidation where the trend lines converge.
To trade bear pennants effectively, traders should wait for the price to break through the trend line, either upwards or downwards. Profit targets can be set by applying the measured move method or using identified support and resistance levels.
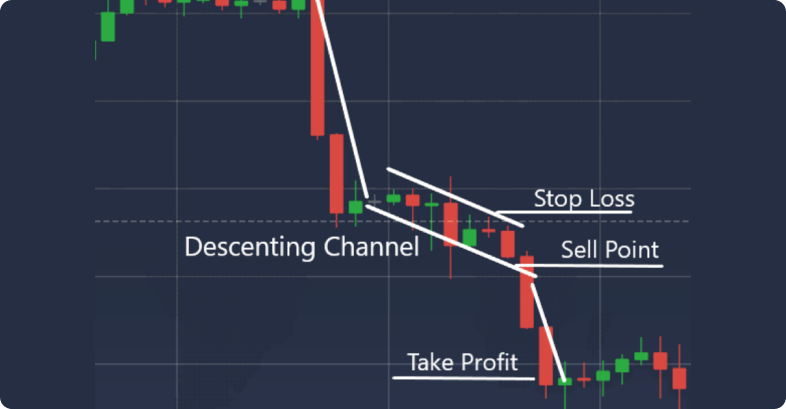
Descending Channels
Descending channels form another variant of the pattern. In this model, the flag manifests as a downward-sloping channel. The initial sharp drop in price acts as the flagpole, followed by a consolidation phase within parallel trend lines.
Traders can approach descending channels in a manner similar to the typical bear flag, looking for the price to break out of the channel. Setting profit targets can be done using the measured move method or through established support and resistance areas.
This pattern offers traders a way to pinpoint potentially lucrative trades and aids in making well-grounded trading decisions. However, it’s crucial to remember that no strategy is foolproof; combining other technical indicators and fundamental analysis is advisable to confirm trends before executing trades.
These patterns are often used by traders when trading stocks to ensure consistent profits.
Common Mistakes to Avoid
A frequent error traders make is misinterpreting consolidation patterns as bear flags. It’s crucial to distinguish a general consolidation from a bear flag to avoid entering trades at inopportune times. While consolidation is a temporary pause in the trend, a bear flag suggests a continuation of a downward trend.
Ignoring Market Context
Another mistake is neglecting the overall market context. It’s essential to consider the overall market conditions and other technical indicators that confirm the trend direction. Trading solely based on the bear flag without considering additional factors can lead to erroneous decisions.
Overlooking Volume Analysis
Volume analysis is critical in determining the reliability of the pattern. Ignoring volume analysis can lead you to enter a trade at the wrong time or miss a profitable trading opportunity. Low volume during consolidation suggests a lack of market participant interest, which can lead to a false breakout or failure.
Risks of False Breakouts
False breakouts are a common pitfall in trading bear flags. A false breakout occurs when the price briefly moves below the lower trendline but quickly reverses back into the consolidation area. To mitigate this risk, wait for confirmation of the breakout, such as a retest of the broken trendline or additional bearish signals.
Premature Entries
Entering a trade too early, before the breakout is confirmed, is another common mistake. Premature entries can result in significant losses if the price reverses. Always wait for clear confirmation of the breakout to ensure the pattern is valid.
Lack of Stop-Loss Orders
Failing to set stop-loss orders can lead to substantial losses if the trade goes against you. A stop-loss order helps manage risk by automatically closing the position at a predetermined price level. Place your stop-loss above the upper trendline of the flag or at a level that aligns with your risk tolerance.
Overleveraging
Using excessive leverage in trading can amplify losses, especially if the bear flag pattern fails. Ensure you use appropriate leverage and do not risk more than you can afford to lose.
By avoiding these common errors, traders can make more informed decisions and steer clear of potential losses. It’s important to use a combination of technical and fundamental analysis tools to confirm the trend direction before executing trades. Risk management through setting stop-loss levels and taking profits at predetermined points is also crucial for successful trading.
Wrap Up
The bear flag represents a critical concept in technical analysis, serving as a reliable indicator for predicting the continuation of a downward market trend. Its effectiveness lies in its clear structure—comprising a sharp initial decline, a consolidatory flag, and a decisive breakout that resumes the downtrend. For traders, mastering the identification and application of the bear flag pattern is essential for capitalizing on bearish market opportunities, enhancing the effectiveness of their trading approaches.
However, successful utilization of the bear flag pattern requires careful consideration of volume, pattern duration, and overall market context to ensure its reliability. Traders must also integrate this pattern with other technical indicators to avoid common pitfalls such as misinterpreting market signals or ignoring broader market trends. When used judiciously alongside a comprehensive trading plans that includes both technical and fundamental analysis, the bear flag pattern can significantly improve decision-making processes in trading, leading to more informed and potentially profitable investment choices.
Looking for a Coupon to save on Sabio plans? Visit our coupon page on Wethrift.