The Fundamental Definition
From a fundamental point of view, a stock is oversold when its market price falls below its intrinsic value.
This is caused by a sell-off, usually following negative news that causes investors to overreact and panic-sell.
If the company’s profitability and earnings per share look good, this a sign that the market overreacted.
Overall, fundamental investors check if the company’s long-term outlook remains strong despite a crashing price. If positive, it becomes a good investment opportunity for the long term.
I highly suggest you look deeper into fundamental vs technical analysis. Although different, they can be used in conjunction to improve your trading strategies across different time horizons. Traders and investors can take advantage of these two methodologies.
| Technical Analysis |
Fundamental Analysis |
| Reliant on the Relative Strength Index and Stochastic Oscillator. People also use moving averages to identify overbought and oversold conditions by comparing the distance between indicators and price. |
Fundamental indicators are Intrinsic Value, EPS, P/E Ratio, ROE, and Debt-to-Equity. The main goal is to measure the company’s financial health. |
| Technical indicators point out that momentum reached an extreme downward. Prices are way below the recent average. |
Fundamental analysis’s target is to define if the actual value might be higher than the current market price. In other words, define if stocks are cheap or not. |
How to Determine if a Stock is Oversold Using Indicators
It’s very unlikely you’ll be able to correctly grasp if a stock is oversold only by looking at naked price charts. Most people use indicators to identify oversold levels by comparing recent price changes to past data.
1. Relative Strength Index
The RSI is the supreme choice when picking a momentum indicator. It stays within 0 and 100 and it is based on the speed and change of price movements.
A particular stock happens to be oversold when we drop below 30 on the RSI reading. The other way around happens when the RSI crosses above 70. That’s how we define that a stock is overbought.
Here’s how we compute the RSI:
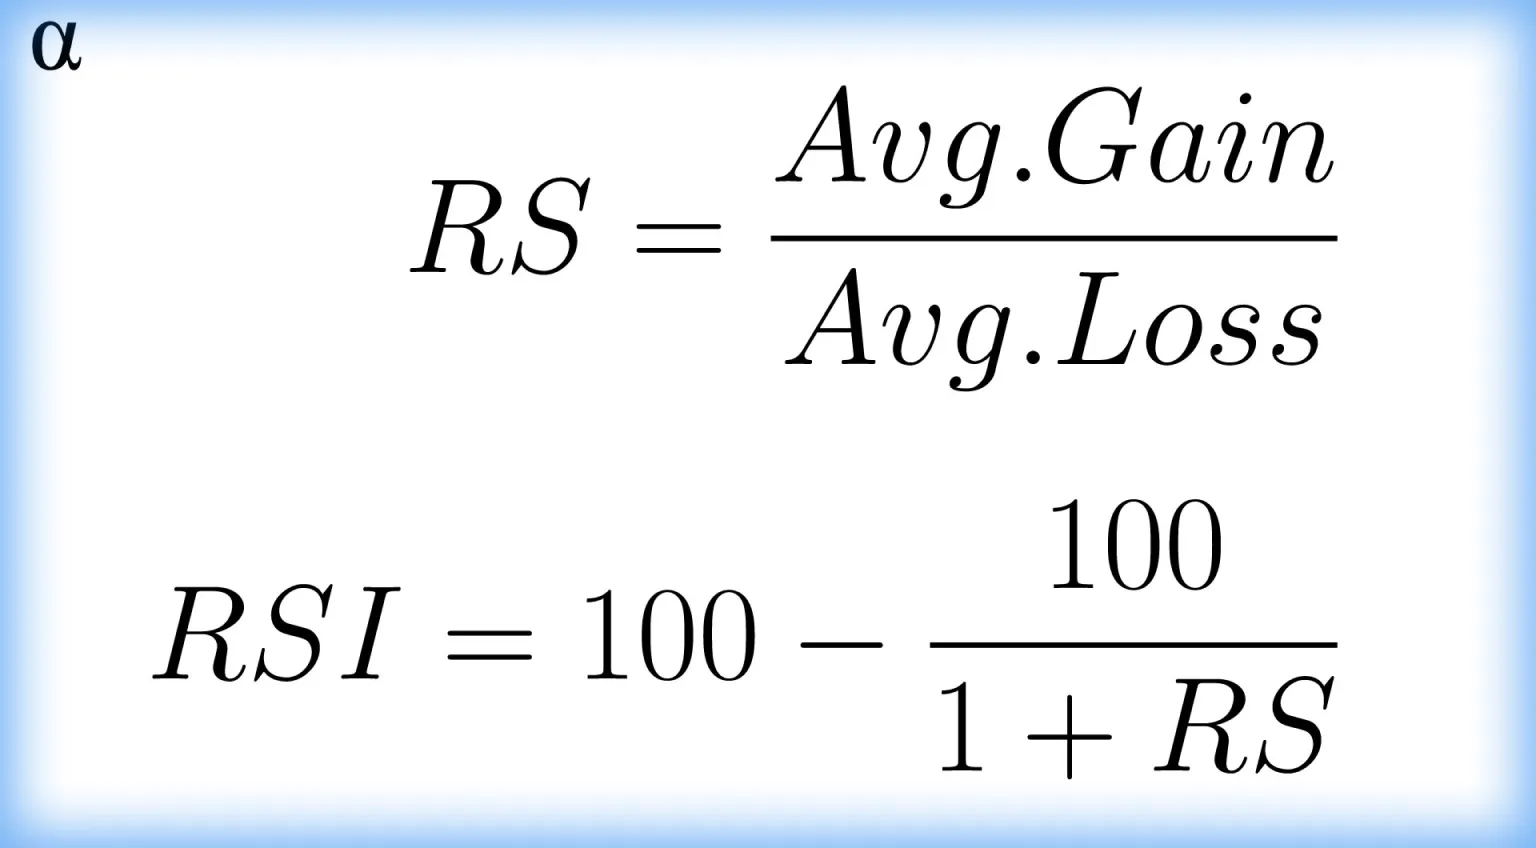
The RSI also shines as a divergence detector. When prices make a lower low, but the RSI makes a higher low, it could indicate a bullish divergence, meaning that the buy-side is slowly accumulating to push prices onto upper grounds.
2. The Stochastic Oscillator
Another popular “oversold indicator” is the Stochastic Oscillator. It compares the stock’s closing price to its most recent price range over a timeframe.
In general, it shows where the current price is relative to its recent highs and lows.
The %K line formula is:
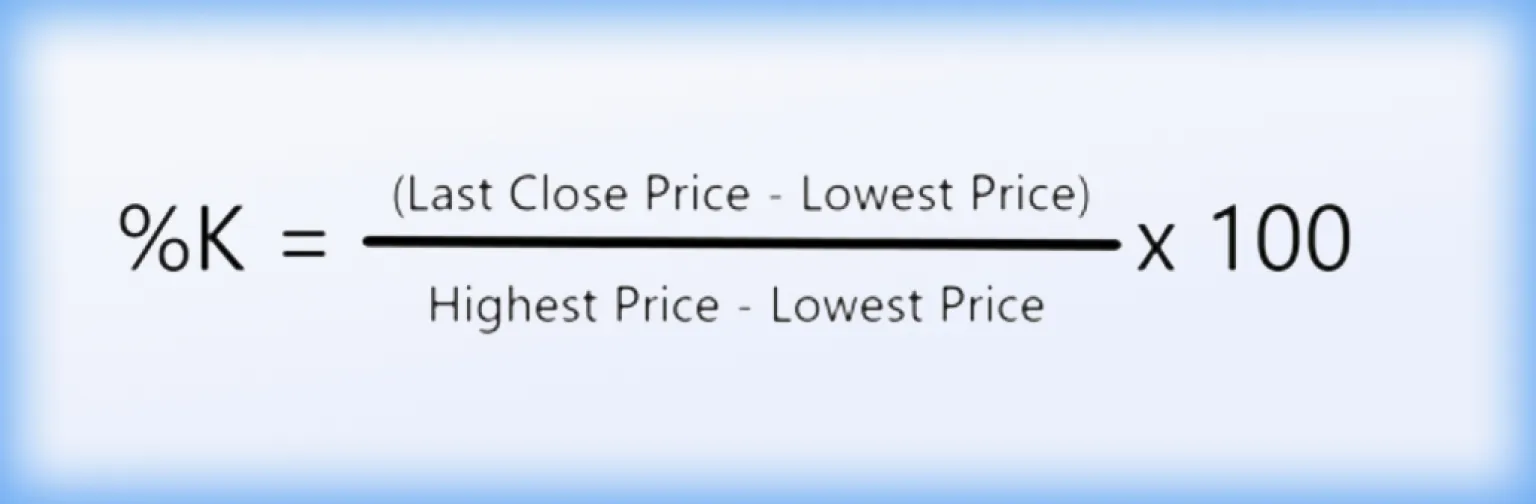
%K below 20 shows the stock is considered oversold. When the %K line crosses above the %D line within this zone, we can keep our eyes open for a possible bounce up.
3. Moving Averages and Support Levels
Besides oscillators, other beloved technical indicators are the moving averages. The 50-day and 200-day SMAs help us draw the trend.
When prices start orbiting too far away from moving averages, especially below them, that can precede a reversion to the mean.
Support levels, zones where prices have historically stopped falling, gives even more confidence for potential reversals.
The RSI and Stochastic Oscillator are among the best indicators for swing trading. It is always worth it to evaluate how they can be used in your trading system, in case you haven’t added them yet.
Why Does a Stock Become Oversold in the Market?
The stock market goes under oversold mode for many reasons. Sometimes due to normal corrections. But sometimes due to unexpected shocks that can cause an entire structural shift.
- Negative News: Poor earnings reports or legal issues can trigger mass exit. When that happens, prices crash really fast.
- Panic Selling: Can be a result of several different things. Fear makes investors sell at any price to avoid further losses.
- Algorithmic Trading: When prices hit a certain threshold, especially near support zones, algorithms can start mass-selling. This behavior is similar to a stop-loss being triggered. It can cause a cascade of selling that makes the market crash. These are called Flash Crashes. There are several historical examples you can search on the web (May 6, 2010 Flash Crash and 2017 Ethereum Flash Crash).
- Macroeconomics: Geopolitical events and interest rates also affect volatility. They can provoke a sharp downtrend and push prices into oversold territory.
Is an Oversold Stock a Bullish Buy Signal for Stock Trading?
I know how tempting it is to hit the Buy button as soon as you see that a stock is trading under oversold conditions.
But there is 1 issue: stocks can stay oversold for a long time during bearish trends.
The number one error beginners fall into is buying when the RSI bounces back from 20. They then expect to ride a new bullish trend and make big profits. But that’s not how it works. Oversold stocks have many small rebounds before the downtrend continues. It takes several of those to confirm a factual trend reversal. If you’re neglecting risk management, you can get your trading account wiped out before you catch a new upward trend.
Winning traders only consider buying after higher lows. They also keep an eye out for increased volume to confirm that a true reversal emerged.
Checklist Before Buying Oversold Stocks
- Check the long-term trend. Opening positions against it is an increased risk.
- Take a look at the fundamentals, even if you consider yourself to be a solely-technical trader. Check if the company has a positive outlook. That can give an idea on whether the buy-side or sell-side should have more leverage over time.
- Look for divergences. Momentum indicators have two main strengths. One of them is highlighting overbought or oversold levels, the other is warning when accumulation is taking place under the curtains.
- Identify relevant support levels by looking at past price action. They tend to give a lot of opportunities for price reversals and rebounds.
- Monitor volume before making any move. Price patterns without volume are unreliable.
Practical Analysis: Is the Market Currently Oversold?
The current situation has markets exhibiting higher prices after recent dips. The tech sector, more specifically, experienced large sell-offs since the beginning of the year.
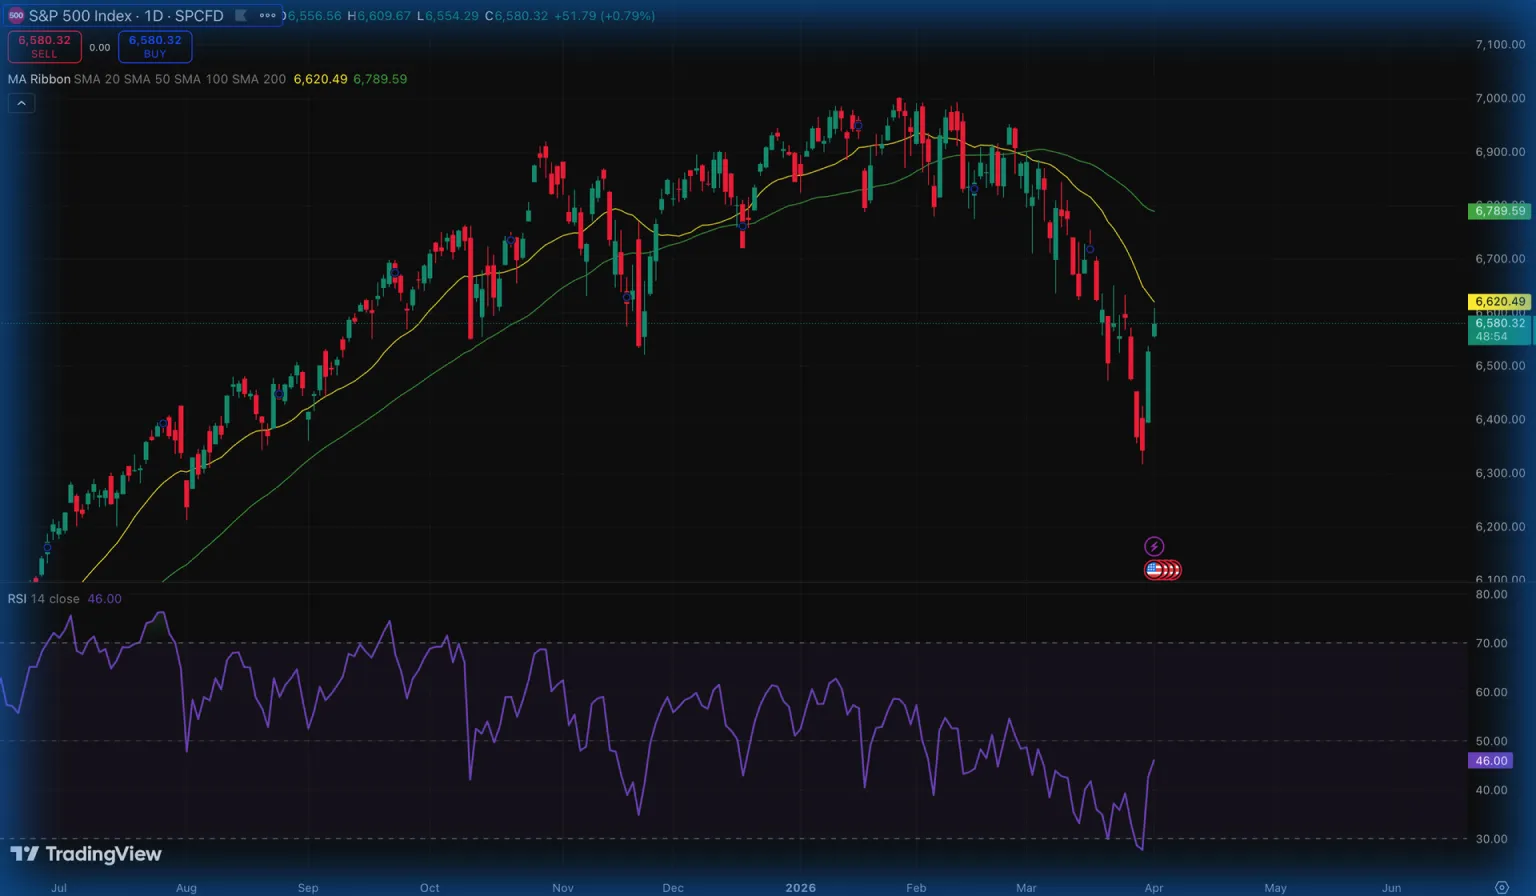
The S&P 500 (main benchmark) is currently testing the 20-day moving average at the yellow line. The RSI is moving towards 50 after bouncing back from 25 due to a bearish leg.
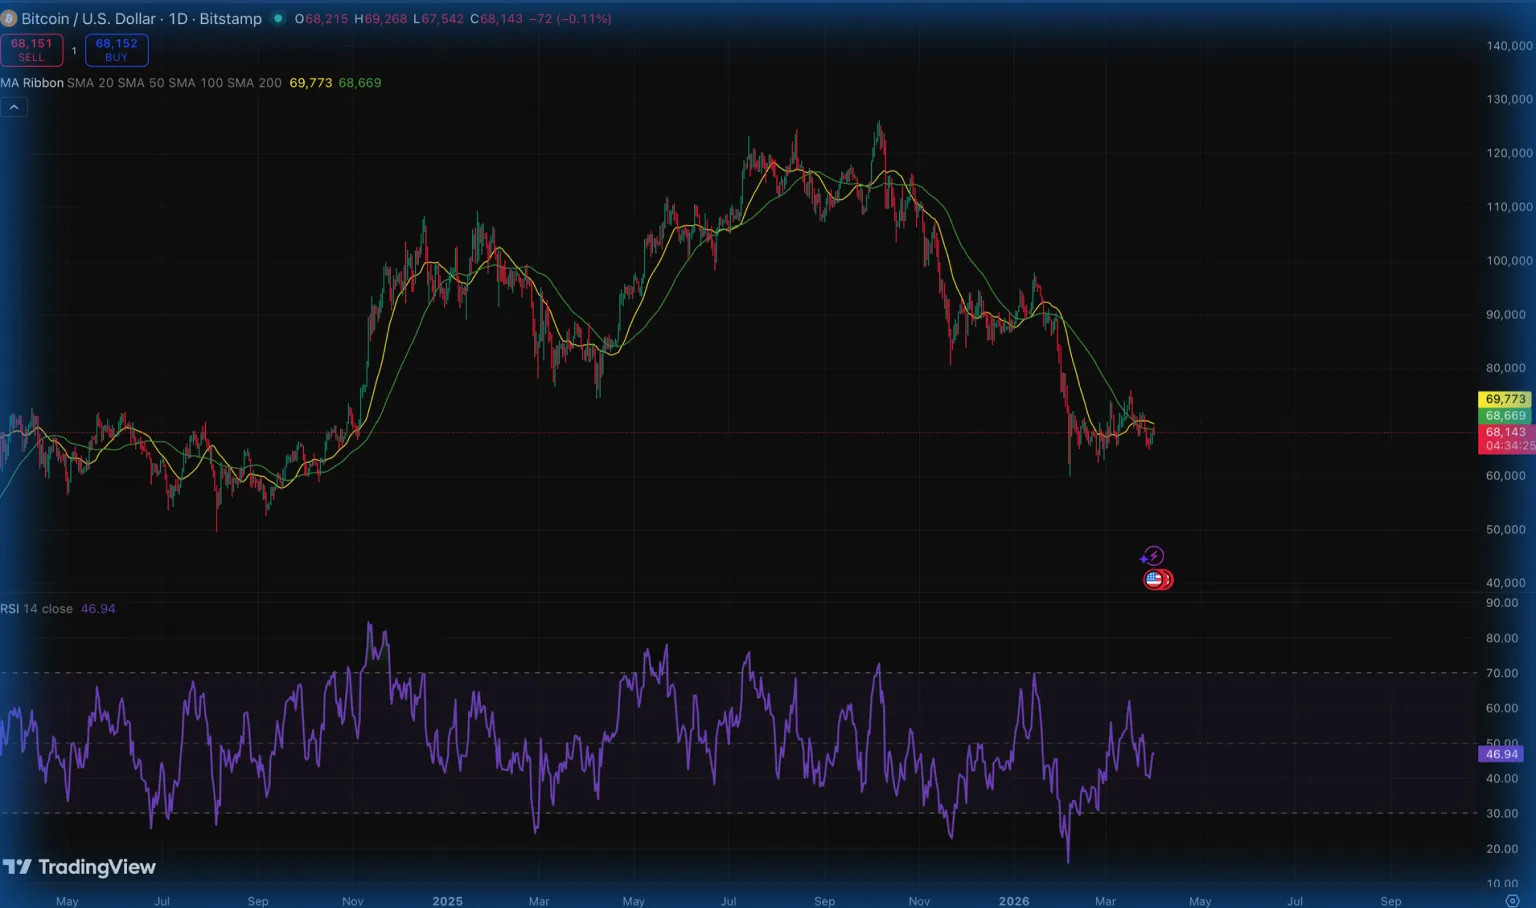
For crypto, we can look at Bitcoin to have an idea of how the market is performing overall. The image below shows that BTC has experienced a significant drop. However, in most recent days, we have a total lack of trends. Prices are moving around the 20-day and 50-day moving averages and the RSI is orbiting the middle ground. This can either be a sign of accumulation for a trend reversal or accumulation for further bearish pressure. The RSI-price movements show convergence, instead of divergence, with both marking lower lows and highs.
Conclusion
It’s very hard to define whether a stock is oversold or overbought just by looking into price charts alone.
Although candlesticks do give us signs, they don’t tell us the full story.
We’re lucky though that momentum indicators can give us additional info on important zones. The RSI flags when prices reach extremes. Moving averages highlights the trend and measures how far away prices have moved from the mean.
Oversold stocks are a result of different factors. Mostly (but not always!) they come from panic-selling. And when others overreact, you can do it differently and gain an advantage over them.
If the value of a stock points towards oversold conditions, you can treat that as a puzzle. Use every single tool in your trading system to solve that puzzle.
With sober analyses and risk management, you can very well succeed. These two make a whole lot of difference between who makes money with oversold stocks and who loses it. Don’t be like the average Joe who keeps trying to catch the falling knife.