How to Use Bollinger Bands in Trading
Developed by John Bollinger in the 1980s, Bollinger Bands are a widely used technical indicator that helps traders find opportunities across different sectors of financial markets. Due to how efficient and versatile it is, this indicator has become a part of many traders’ toolkits, from Forex to stocks.
This indicator consists of a simple moving average and an upper and lower band around it. It is quite accurate in keeping track of market volatility and visually helps you identify overbought or oversold levels.
At its core, these are its three main elements:
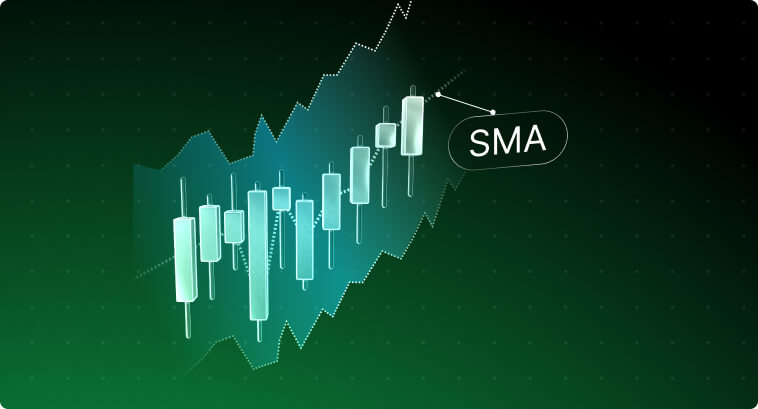
- Middle Bollinger Band (SMA): By default, it is a 20-period moving average. It provides a rolling average price over a specific time frame and smooths out all the noise.
- Upper Bollinger Band: It is positioned above the SMA and is typically set two standard deviations above the moving average. It can also act as a moving resistance level.
- Lower Bollinger Band: Positioned right below the SMA, this band is also set two standard deviations below the moving average by default. Many traders also see it as a moving support level.
The calculation of both upper and lower bands is based on measuring the overall dispersion of data points from the average, as you can see below:
- Upper band = SMA + (Standard Deviation * Multiplier)
- Lower band = SMA – (Standard Deviation * Multiplier)
This formula allows the bands to capture volatility over the last defined periods—usually 20 days as a default for the moving average. When volatility is high, the bands widen; when volatility is low, the bands narrow down.
Using Bollinger Bands on TradingView
To effectively integrate this indicator into your skillset, you first have to understand how to set it up on your preferred technical analysis platform. My favorite platform is TradingView, which is the one we will go through here.
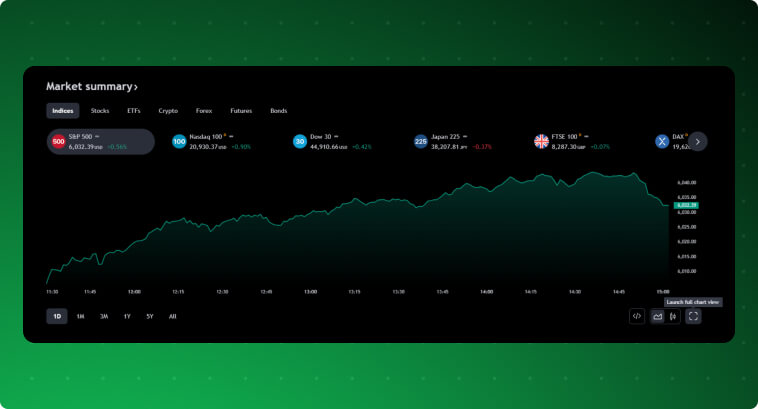
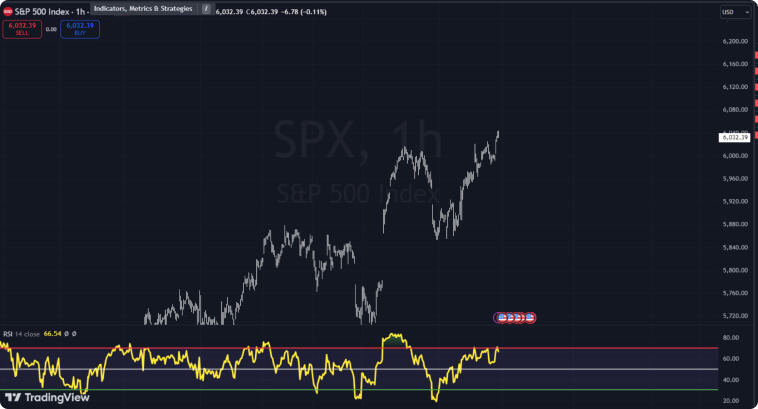
Go to TradingView and scroll down until you see a line chart below the tile Market summary. Click on Launch full chart view to open up the price chart where we will set up the Bollinger Bands.
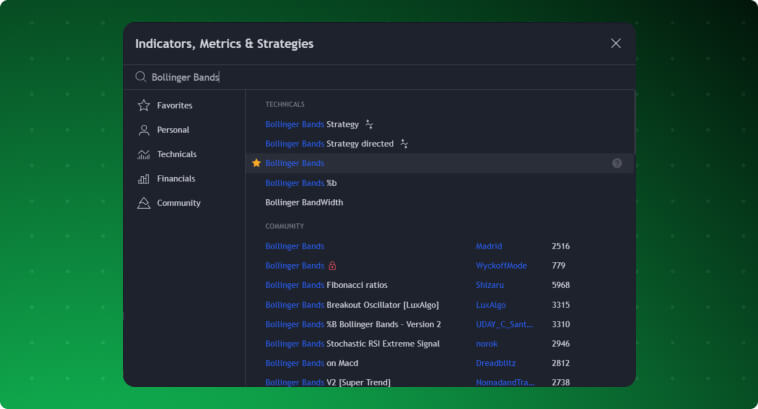
You can then click on Indicators in the upper menu and then search for Bollinger Bands on the new menu that will open up. Several options will show up. Select the one that says Bollinger Bands.
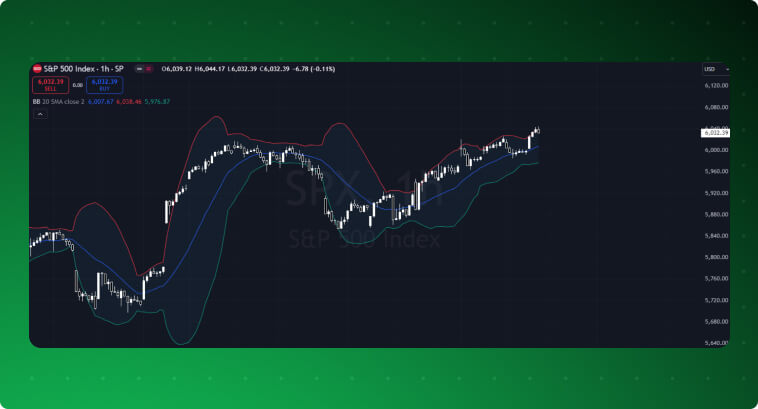
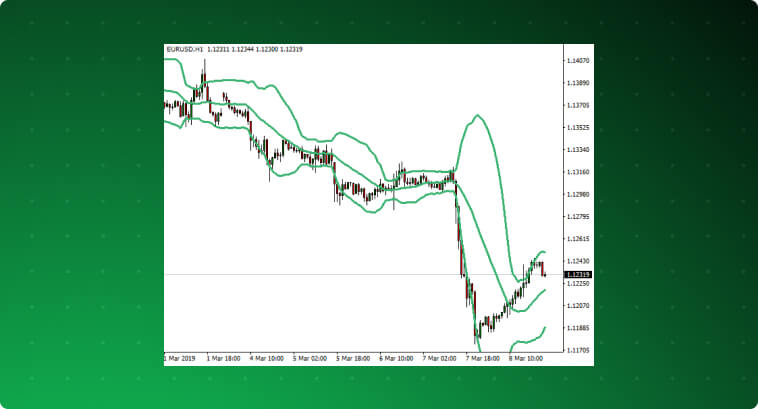
After selecting it, you will see the indicator around the candles in the chart. The red line is the upper band, the blue line is the 20-hour moving average—notice that I’m on an hourly chart in the image—, whereas the green line is the lower band.
Setting up Parameters
On TradingView, you can alter the setup of the indicator by hovering your mouse on the BB indicator panel and clicking on the Settings button.
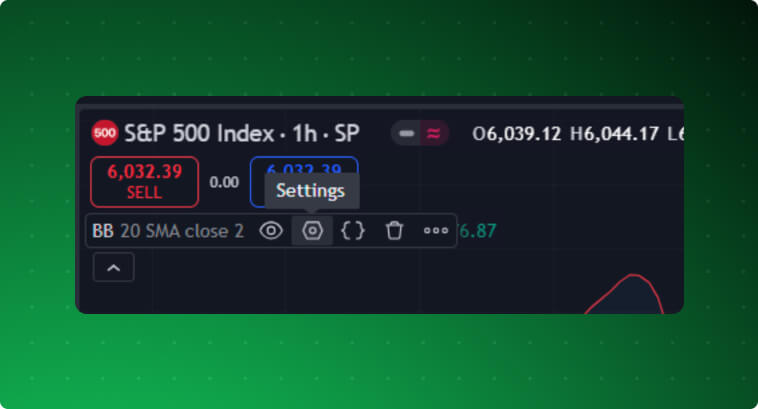
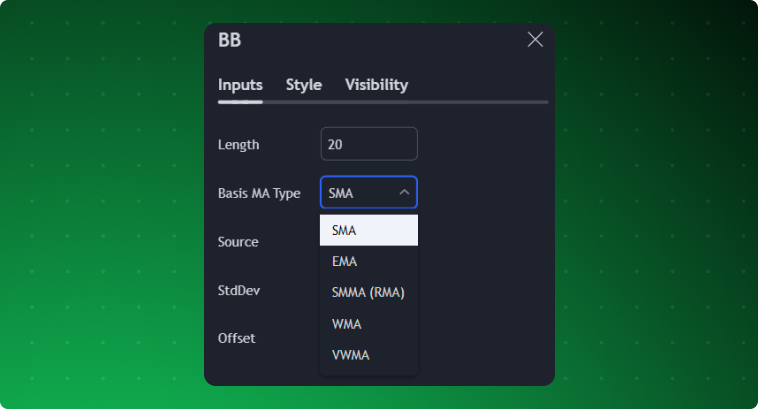
There will be three different menus available on the new window. Click on Inputs to see the indicator’s parameters.

The typical period setting for Bollinger Bands is 20, as you can see in Length. This means the bands will use the last 20 closing prices, as you see in Source, to calculate their values on candlestick charts.
By looking at the StdDev parameter, you can see the default is 2 standard deviations from the SMA for each band.
The Basis MA Type parameter allows you to use different methods to calculate the standard deviation. It can be a simple moving average, or an exponential moving average, among others. The best method depends on your trading style. Exponential moving averages give more weight to recent data points, which can be faster to capture the most recent tendencies in price action.
Different Features for Different Trading Strategies
Trade signals will be more effective when you adapt your indicators to each market condition. Don’t hesitate to customize the features and parameters, alter the MA type, try different multipliers, or add different numbers of standard deviations to your price chart.
Assets known for being more volatile like cryptocurrencies can benefit from a shorter period length—10 or 15—, whereas longer periods like 50 may be more suitable for large-cap stocks.
If you’re a beginner, start with the default settings, as they provide a balanced view of how volatility affects the price of an asset. But over time, I recommend you learn the intricacies of each asset you usually trade and focus on tweaking the parameters for generating trading signals that reflect the asset’s behavior more accurately.
Bollinger Bands Trading: Strategies
Bollinger Bands can be used for several different strategies. Traders can use this indicator for volatility trading, mean reversion trading, and the upper and lower bands as moving resistance and support levels. Below, we will explore how this indicator can give us several potential trading opportunities.
Volatility Indicator
Traders typically use Bollinger Bands to keep track of market volatility. In the image below, we see a case of increased volatility when the price breaks below the lower band, which opens the opportunity for going short. On the other hand, when the price breaks above the upper band, there’s an opportunity to go long. These breakouts usually lead to explosive price movements, allowing us to make large profits. You can see how the sudden widening of the bands reflects higher volatility and larger candles.
Down below we have an example of how Bollinger Bands might reflect events. Before the 2020 pandemic, we can see that the S&P100 was on a slow, albeit uptrend. As soon as the news broke that the WHO declared Covid-19 a global pandemic, prices dropped fast. This drop resulted in a surge in volatility, reflected by the widening of the Bollinger Bands.
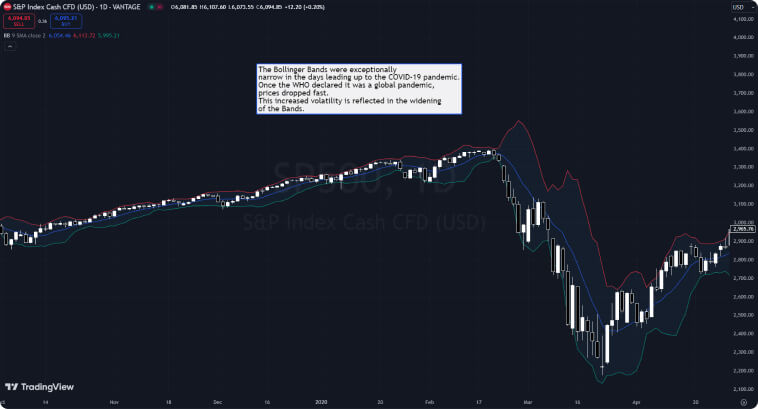
In a scenario like this, most traders would prefer to stay out of the market, since higher volatility results in less-predictive price action. Traders who are prone to risk-taking could open a short position to take advantage of the panic and profit from this price drop.
Step-by-Step for Beginners: Trading with Volatility Breakouts
Entries:
- Go long when the price breaks above the upper Bollinger Band, indicating a bullish breakout.
- Go short when the price breaks below the lower Bollinger Band, indicating a bearish breakout.
Additional Indicators to Avoid False Signals:
- Volume: Confirm that the breakout is accompanied by an increase in volume.
- Moving Average: Use a moving average to determine the overall trend direction and avoid counter-trend e.ntries
Optimal Bollinger Band Settings:
- Longer Timeframes (Daily, Weekly): 20-period, 2-standard deviation
- Medium Timeframes (4 Hours, 1 Hour): 20-period, 1.5-standard deviation
- Short Timeframes (15 Minutes, 5 Minutes): 10-period, 1-standard deviation
Risk Management:
- Stop Loss: Set just outside the breakout candle’s range to limit losses.
- Position Sizing: Keep risk to 1-3% per trade, especially in high-volatility scenarios.
- Take Profit: Consider using trailing stops or a predefined risk-reward ratio to take profits. As volatility increases, the riskier the market gets.
Extra Tips:
- Understand that higher volatility can mean less predictable price action, so trade with extra caution and reduce your position sizing.
- Consider staying out of the market during major news events unless you’re very comfortable with higher risk.
- Always test your strategy on a demo account before trading with your real money.
Bollinger Bands Squeeze
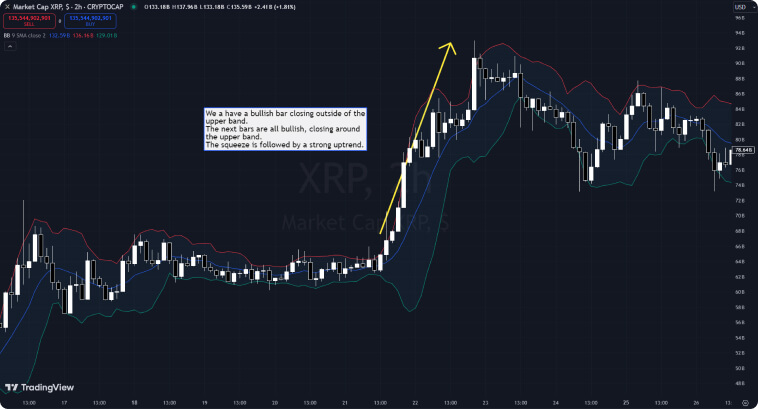
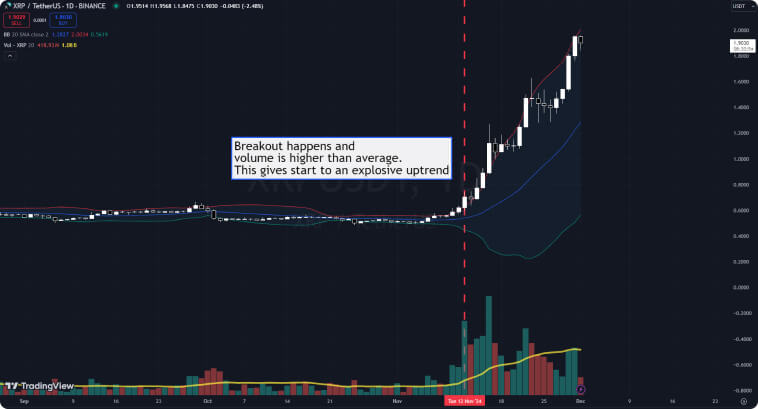
Another strategy is the Bollinger Bands Squeeze, which occurs when the width of the bands contracts as a result of market consolidation. The squeeze usually indicates that the market is gearing up for an expansion, so traders start waiting for a breakout of the upper or lower band. The image below demonstrates how this pattern works. The bands squeeze tightly together before eventually breaking out into an explosive uptrend.
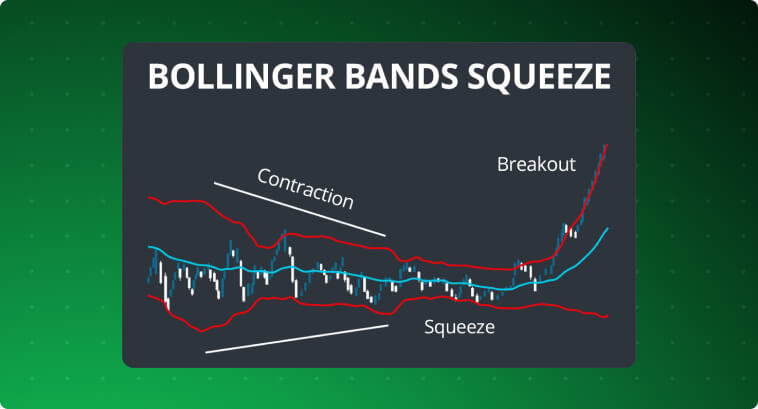
In the image below, it’s possible to see how Bollinger Bands can help you enter an explosive uptrend after a squeeze happens. Prices start to bounce around a short range, making the bands narrower. We have a bullish candle in the 2-hour chart that closes above the upper band. We can see that bears tried to take prices down but failed to do so in this candle and the next one. This pattern leads to an explosive uptrend.
Step-by-Step for Beginners: Bollinger Bands Squeeze Strategy
Entries:
- Watch for the Bollinger Bands to contract (narrow range). This is a clear signal we’re in a period of market consolidation.
- Enter when a candle decisively closes above the upper band—for a bullish breakout—or below the lower band—for a bearish breakout.
Additional Indicators to Avoid False Signals:
- Volume: A large increase in volume on the breakout candle can confirm the move’s strength.
- Moving Average: If you’re a beginner, it might be a good idea to only enter trades where the price is breaking out in the same direction as the main trend. You can assess the main trend by comparing short-term (20-period) and long-term (200-period) moving averages.
Optimal Bollinger Band Settings:
- Longer Timeframes (Daily, Weekly): 20-period, 2-standard deviation
- Medium Timeframes (4 Hours, 1 Hour): 20-period, 1.5-standard deviation
- Short Timeframes (15 Minutes, 5 Minutes): 10-period, 1-standard deviation
Risk Management:
- Stop Loss: Set just below the breakout candle’s low—for bullish entries—or just above its high—for bearish entries.
- Position Sizing: 2-5% risk per trade
- Take Profit: Aim for a predefined risk-reward ratio (e.g., 1:2 or 1:3) or use trailing stops to ride the trend.
Extra Tips:
- Wait for a full candle close outside the band, not just a brief spike.
- Combine with momentum indicators (e.g., RSI or MACD) for confirmation.
- Adjust settings based on market volatility.
- Test the strategy on a demo account before using your own money.
Overbought and Oversold Levels
Another very straightforward way of trading with Bollinger Bands is using the upper and lower bands as moving support and resistance levels. In this approach, you will be monitoring for overbought and oversold levels. This is a strategy that works well in quieter markets, including stocks.
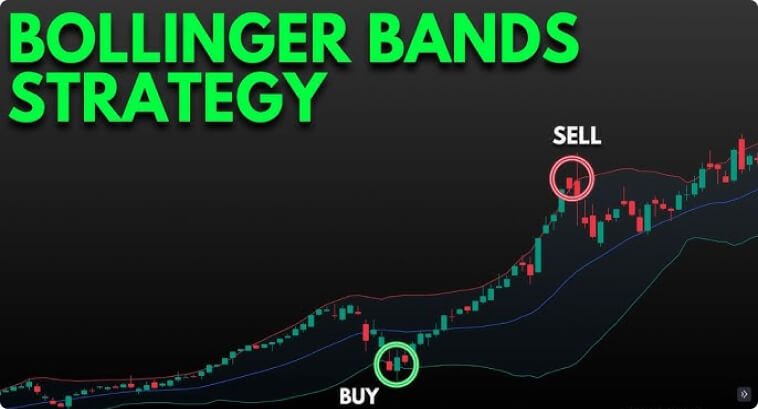
The image below illustrates this approach. You would typically buy when a candle closes inside the lower band right after closing below it. You would then sell when prices break through the upper band and close back below it in the next candle.
It is important to remember that this strategy, although straightforward, has to be carefully analyzed. If candles keep closing outside the lower or upper bands consistently, it doesn’t indicate that the asset is overbought or oversold. It can be a sign of a new trend emerging and you definitely want to trade in the direction of this new trend, not against it.
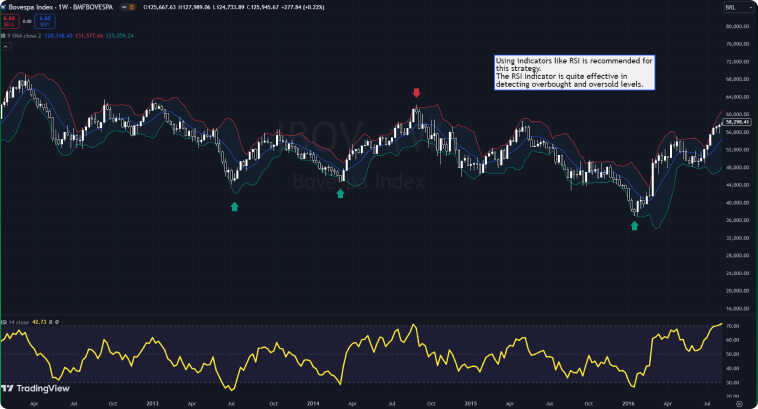
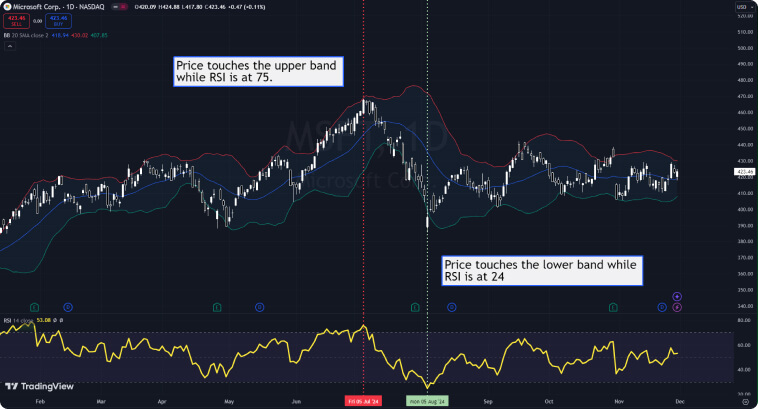
We can see an example of this strategy playing out in a real-world scenario. Prices are within a range, so Bollinger Bands are an effective way of buying when prices touch a support level and selling when they touch a resistance level—considering that the bands are moving support and resistance levels. I always suggest using an indicator like RSI for this strategy, as it gives you more clarity on overbought and oversold levels. Going long when prices touched the lower band and RSI was below 30—and going short when the opposite happened—proved to be an effective strategy here.
Step-by-Step for Beginners: Trading Overbought and Oversold levels.
Entries:
- Buy when a candle closes inside the lower Bollinger Band after previously closing below it.
- Sell when prices break through the upper band and close back below it on the next candle.
Additional Indicator to Avoid False Signals:
- RSI: Confirm oversold (<30) and overbought (>70) levels.
- Moving Average: Use short-term (20-period) and long-term (200-period) averages for trend alignment.
Optimal Bollinger Band Settings:
- Longer Timeframes (Daily, Weekly): 20-period, 2-standard deviation.
- Medium Timeframes (4 Hours, 1 Hour): 20-period, 1.5-standard deviation.
- Short Timeframes (15 Minutes, 5 Minutes): 10-period, 1-standard deviation.
Risk Management:
- Stop Loss: Set below the lower band when you buy and above the upper band when you sell.
- Position Sizing: 2-5% risk per trade.
- Take Profit: Opposite band or a predefined risk-reward ratio.
- Trend Alignment: Trade in the direction of the long-term trend (200-period moving average).
Extra Tips:
- Monitor candle closure, not just touches.
- Combine with other indicators for confirmation.
- Adjust settings based on market conditions.
- Practice on demo accounts before live trading.
Mean Reversion
Mean reversion is a phenomenon in financial markets that says that prices naturally return to an average level of equilibrium after explosive movements. This average serves as a magnet for prices—a point of “fair value”.
A popular Bollinger Bands strategy involves opening positions expecting prices to revert to the middle band after touching the outer bands. This reversal strategy is quite similar to using the bands as support and resistance levels, but this one is more focused on short movements, where people try to benefit from pullbacks and retracements within ongoing trends. This strategy is particularly useful for those interested in scalping in Forex trading.
It tends to be riskier, especially in intraday, and traders usually ride the market for a shorter period before cashing in the profits. The image below shows an example of intraday price action, where prices kept touching the upper band and then reversed back to the mean during an uptrend.
Step-by-Step for Beginners: Trading Mean Reversion.
Entries:
- Enter a trade expecting the price to return to the middle Bollinger Band after it touches the outer band and shows signs of slowing momentum.
- In an uptrend, consider going short when the price hits the upper band and begins to pull back; in a downtrend, consider going long when the price hits the lower band and starts moving back toward the mean.
Additional Indicator to Avoid False Signals:
- RSI: Look for RSI divergence or neutral readings (around 40-60) to confirm potential mean reversion rather than a strong trend continuation.
- Moving Average: Use short-term (20-period) and long-term (200-period) moving averages to determine the overall trend direction and avoid trading against a strong primary trend.
Optimal Bollinger Band Settings:
- Longer Timeframes (Daily, Weekly): 20-period, 2-standard deviation.
- Medium Timeframes (4 Hours, 1 Hour): 20-period, 1.5-standard deviation.
- Short Timeframes (15 Minutes, 5 Minutes): 10-period, 1-standard deviation.
Risk Management:
- Stop Loss: Place stops just beyond the outer band to minimize losses if the price doesn’t revert as anticipated.
- Position Sizing: Keep risk at 1-3% per trade.
- Take Profit: Target the middle band or a predefined risk-reward ratio.
- Trend Alignment: Even though this is a counter-move strategy, ensure you’re not constantly fighting a dominant market trend, which can be identified by looking at longer-period moving averages like 100 or 200.
Extra Tips:
- Monitor candle closure rather than just wicks touching the bands.
- Combine this approach with other indicators (e.g., MACD or Stochastic) for confirmation.
- Adjust your settings based on current market volatility.
- Practice on a demo account before applying this strategy with real money.
False Signals and Limitations of Bollinger Bands
Do Bollinger Bands work? Yes, they do! But they still have limitations. It is a rookie mistake to rely on them alone or not look into the bigger picture before opening a position. False signals are quite frequent and you want to avoid being on the wrong side of the trend.
For the most common strategies of Bollinger Bands trading, here are some important guidelines:
- Breakout After Compression: To avoid false signals, wait for a strong candlestick to close outside of the band after a period of narrow bands. Enter in the direction of the breakout and be aware of trading volume as well—breakouts without significant trading volume might be a trap. Set a stop loss just inside the band and ride the wave. Use trailing stops as a take profit.
- Overbought and Oversold Levels: In this strategy, you tend to buy when the price touches the lower band and sell when the price approaches the upper band—and vice-versa. This strategy can work better with additional tools to confirm trading signals. Oscillators like the RSI can increase accuracy quite well. You should set a stop loss below the lower band if buying or above the upper band if selling. Take profits are usually placed near the opposite band in this strategy.
- Mean Reversion Strategy: This strategy tends to be employed when markets are trending. You can enter when prices bounce back from the outer bands in the direction of the middle band. Stop losses are usually set near the upper Bollinger Band when selling and near the lower Bollinger Band when buying. The take profit is usually near the SMA.
Remember to adjust stop losses dynamically as the market moves favorably toward your target. Avoid over-leveraging and keep risk management in mind.
Combining Indicators
Trading strategies using Bollinger Bands are effective but profitable trading usually comes from combining multiple trading tools together. Some of the most common combinations include:
- Bollinger Bands and Relative Strength Index (RSI): The RSI indicator is useful to identify overbought and oversold conditions. This combination can help you buy more accurately when both the price touches the lower band and the RSI is below 30—clear indicators that the asset is oversold. When prices touch the upper band and the RSI is over 70, there’s an opportunity to go short.
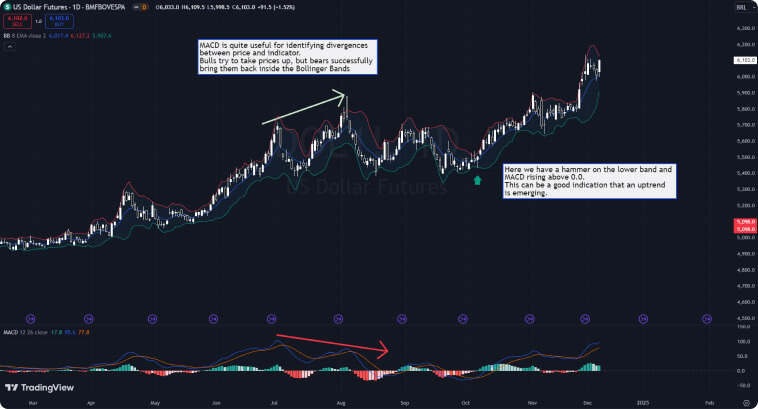
- Bollinger Bands and Moving Average Convergence Divergence (MACD): The MACD indicator can be particularly useful in identifying trend direction and momentum. Combining it with the Bollinger Bands may help filter out false signals. If the MACD line crosses upwards while prices break out above the upper bands, this can be a signal to enter a long position with the expectation of riding a new uptrend. You can also use the MACD as a strong indicator for price divergences.
- Bollinger Bands and Volume Indicators: When Bollinger Bands adjust to price and get narrower, there is a good chance that an explosive breakout is imminent. However, breakouts tend to be not very effective when they lack volume. When a large candle breaks out of Bollinger Bands, keep an eye on volume: volume larger than the average, big candles, and closures outside the bands are all great indicators that this breakout can lead to an explosive trend for the next few days or periods.
Besides the RSI, MACD, and volume, there are many other indicators and strategies you can add to your toolkit alongside Bollinger Bands to identify opportunities. I highly suggest reading more about effective trading strategies to acquire in-depth knowledge on the matter and learn how you can adapt different tools and strategies to your trading system.
Bollinger Bands for Day Traders
Bollinger Bands can also help day traders in finding opportunities in intraday charts. Most day traders use 5-minute to 15-minute charts to capture price action and react quickly to make profits. To day trade using Bollinger Bands more effectively, it is a good idea to adjust its parameters to a shorter period, such as 10. This will make the indicator more responsive to the most recent price movements. You can also try using an exponential moving average for the middle band.
In an intraday trading session, the strategies used for Bollinger Bands are pretty much the same as those used in longer timeframes. You can take advantage of price swings between the bands, looking for overbought and oversold levels, as well as look for breakouts to ride explosive trends when the bands expand when volatility increases. One of the most popular methods, however, is employing a mean reversion strategy during trends, where you go short when prices touch the upper band and make a profit when they touch the middle band.
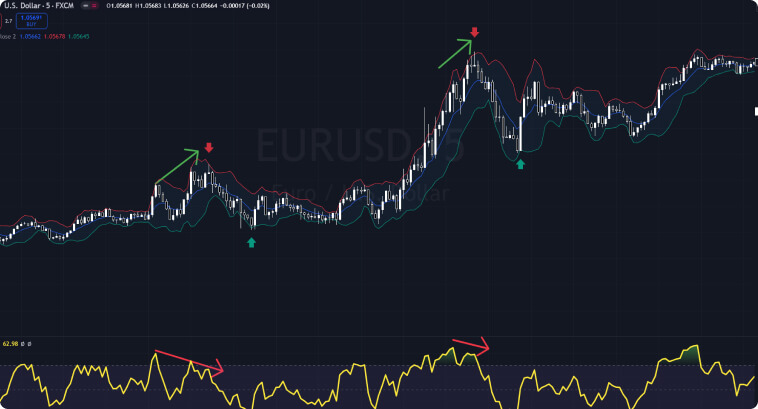
In the image below we have several examples of opportunities appearing on a 5-minute chart for the EUR/USD pair. Notice that I’m using an 8-period exponential moving average for the Bollinger Bands—to capture the most recent price action—and a 9-period for computing the RSI indicator.
Both signals for going short appear when there is a divergence between the price and RSI. Even though the price keeps reaching higher highs, the RSI doesn’t reach its previous peaks. The opportunity to short-sell happens when prices try to close above the upper band and fail plus the RSI is around the overbought level and showing divergence. On the other hand, the signals for going long appear when prices touch the lower band and the RSI is under oversold conditions—very straightforward in this case.
When it comes to day trading, the main focus has to be risk management. Considering the shorter timeframe, you have to adapt to tight stop losses to limit how much money you can lose from breaking news or unexpected events that can drive prices in the opposite direction of your trade. Position sizing also has to be more conservative. I wouldn’t recommend day trading with over 2% of the total account per trade. Use trailing stops to lock in gains as prices move favorably to your entry. You can even use indicators to help you manage trailing stops, such as moving averages, Parabolic SAR, and Chandelier Exit.
Conclusion
Bollinger Bands are among the most versatile and powerful tools for different markets, timeframes, and traders of all experience levels. This popular indicator created by John Bollinger can provide you with highly valuable insights into market volatility, market trends, and signal entry and exit points.
Understanding the core components of Bollinger Bands and adapting their parameters for each different asset is key to improving accuracy and getting the best from price action. Like any other indicator, however, Bollinger Bands tend to be more effective when used alongside other technical analysis tools and risk management practices.
The power behind Bollinger Bands lies in how adaptable they are and how they’re able to make market dynamics clearer. Even though there is not a single indicator that can guarantee success, strategies that combine Bollinger Bands with other indicators can definitely help improve your game and make you gain more insights into the market.
Always remember that markets reward those who prepare and can adapt quickly to different conditions. If you master both of these skills, you’ll be well-equipped to make it!