Mastering High Volatility Trading: Strategies for Capitalizing on Market Opportunities


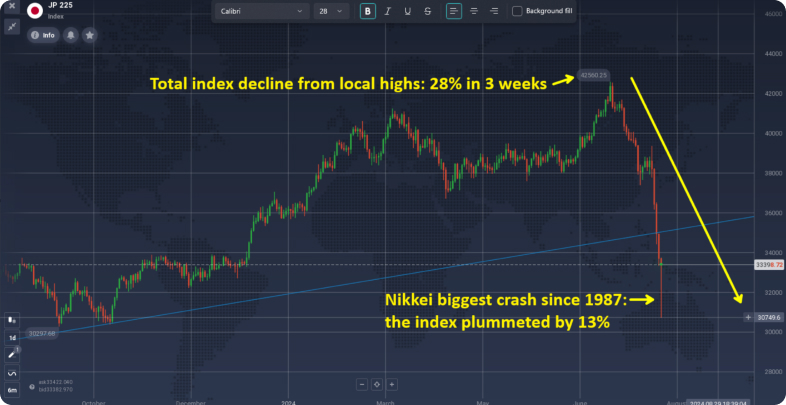
The unexpected crash of the Japanese stock market on August 5, 2024, once again highlighted the importance of situational trading skills to capitalize on market opportunities.

Most of our traders use strategies that work within average volatility, which makes sense: not every day can a trading instrument change in price by 5 or 10 times more than average values. However, such situations do arise and carry both great earning opportunities and additional risks. Therefore, every trader needs to have a “Plan B” for such events.
First of all, you need to understand the cause of extreme volatility. Note that I’m not talking about a decline, as we consider different market situations. It will be useful for you to learn how to analyze both upward and downward volatility spikes. To simplify the concept of trading on volatility, we divide market movements into 2 phases: impulse and correction.
An impulse is the main movement caused by a sharp change in the number of market buyers or sellers, where the market moves in the direction of the impulse, predominantly fulfilling market orders with limit (pending) orders, as the balance of market orders is disrupted. The less liquid the instrument, the stronger it will react to such situations. For example, when news comes out about Japan, USD/JPY will react with less volatility than AUD/JPY, as more traders trade the first currency pair. If you add a possible holiday in Australia to this, you get the “thin” market effect, where the number of trading participants is even smaller, making it harder to keep the price within certain limits. To confirm this, just look at the recent price changes for USD/JPY (-3.2% from the day’s opening to the minimum) and AUD/JPY (-5.4% from the day’s opening to the minimum).
A correction is the phase of returning the price to certain average values after an impulse. This is the market phase we will consider for trading. Of course, in each such situation, it is necessary to understand the reasons for the decline and not enter against the impulse if they are caused by objective macroeconomic data, political events, or changes in monetary policy. But usually, by the time some news is published, traders have several possible scenarios, and really strong movements can only occur with a strong discrepancy between expected options and actual data. Each impulse can potentially be either a continuation of the current movement or its culmination.
1. Impulse + Correction. These are most often V-shaped formations, which allow you to earn if you correctly determine the entry point and set the stop-loss in a safe place. For this pattern to work, it is desirable to have the following criteria:
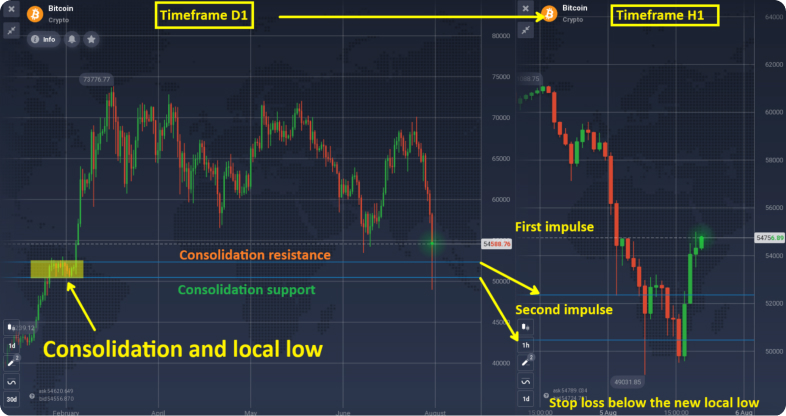
2. Impulse + Consolidation + Impulse. This formation is also often called a double bottom, when the market has not realized the full potential of the movement in one impulse and another wave of decline occurs after some time. This is the most insidious pattern, as placing a stop order behind the local extremum can trigger it, requiring re-entry into the market. Such situations often arise when the market enters a consolidation zone and the first impulse bounces off its nearest border, while the second reaches or breaks the lower border. To avoid premature stop-loss activation, it is better to place it beyond the consolidation border or wait for the end of the second impulse formation and hide the stop-loss behind the new extremum.

After these two scenarios, the market usually either corrects or continues to move in the direction of the impulse.
To increase your chances of success when trading corrections, follow these rules:
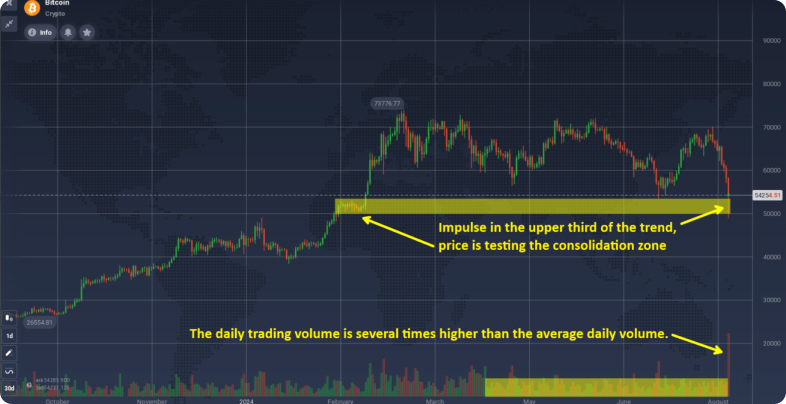
1. The impulse should closely approach, touch, break through, and return to a strong technical level, and ideally update the maximum or minimum price for a long period (six months, a year, or more).

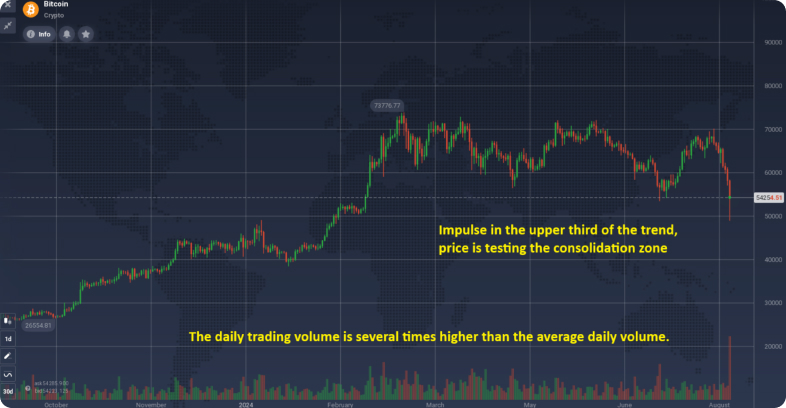
2. If the impulse occurs against the trend, it should be in the last third of the trend movement.
3. It is important that the movement is on a volume that is at least 2-5 times higher than the average daily trading volume of the asset.

What risk management to use in volatility trading
If an impulse can be determined visually, then the Standard Deviation indicator can help understand how strongly a specific impulse affects the deviation of the price from average values. This cumulative effect of unidirectional price movement combined with the impulse can be interpreted as a local culmination of sales or purchases since the market does not simply.
The Standard Deviation (SD) indicator, a mathematical term describing the dispersion of values, plays a pivotal role in financial markets, particularly in Forex trading. The SD indicator measures volatility, showcasing the degree of variation from the average price of an asset. Here’s a comprehensive look at its application, calculation, and significance in trading.
The SD indicator’s curve represents market volatility, growing as price movements strengthen in any direction and shrinking when the range of price changes narrows. Unlike trend indicators, SD does not predict the direction of the price movement but highlights the magnitude of price fluctuations.
Volatility Tracking: Traders use the SD indicator to gauge market volatility. High SD values indicate high volatility, while low values suggest a more stable market.
Trend Confirmation: Though not a trend indicator, the SD can confirm the strength of a trend. A rising SD during a price increase confirms a strong upward trend, while a falling SD indicates decreasing volatility, often seen during consolidations.
Counter-Trend Entries: Some traders employ SD for counter-trend entries, using the rule of three sigmas (99.73% of values lie within three standard deviations in a normal distribution). When SD values are extraordinarily high, it may signal an overbought or oversold condition, potentially indicating a reversal.
When the Standard Deviation curve drops below the minimum value level, the trader:
To access this indicator on the Sabiotrade platform, pay attention to the bottom left corner. By clicking the “Indicators” button, you’ll see a menu with a full list of the indicators where you’ll have to choose “Volatility” and the menu on the right you will find Standard Deviation indicator.