Understanding the Ascending Triangle Pattern in Market Analysis
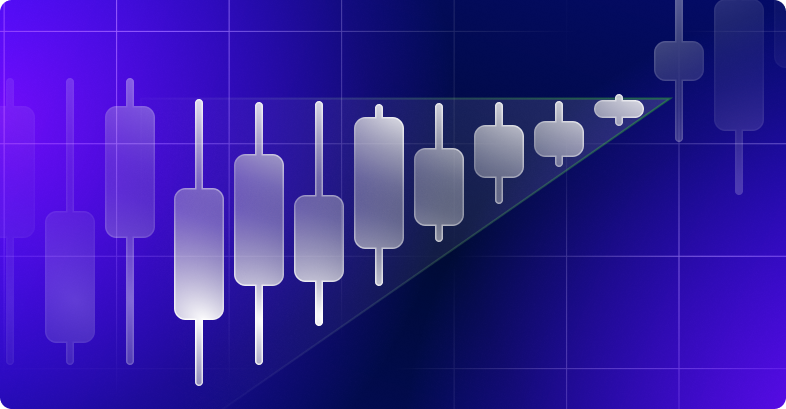
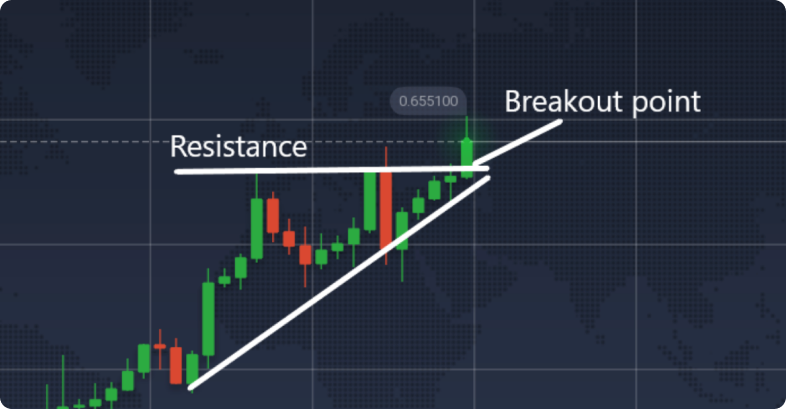
The development of an “ascending triangle” pattern on a chart indicates to traders a potential rapid upward breakout. This pattern is defined by the price being compressed from below. Essentially, while the highs remain consistent, the lows progressively rise, pushing the price toward the upper boundary. Subsequently, this leads to a sharp breakout upward and breaks through the existing resistance. Such a breakout boosts confidence among traders and suggests either the continuation of an upward trend or a shift from a bearish trend.
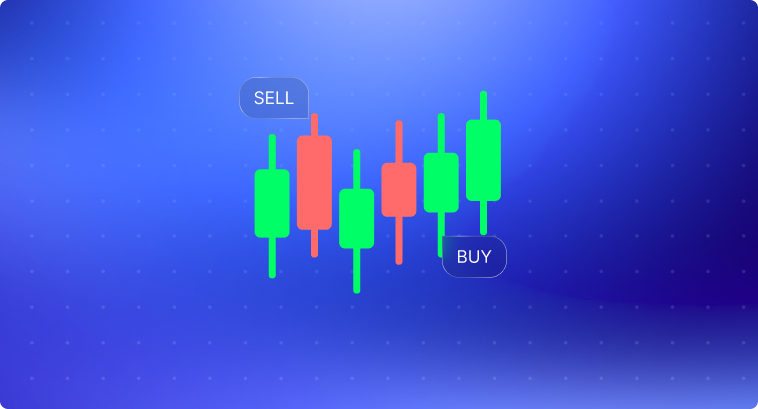
The “ascending triangle” pattern incorporates a sophisticated trading system that includes specific market entry and exit points, as well as the determination of stop-loss levels. The ascending triangle is a bullish continuation pattern that often signals the continuation of an uptrend.
What is an Ascending Triangle Pattern and Why is it Important?
The “ascending triangle” pattern is a price growth model that forms in the shape of a rising triangle. That is, the quotes move in an accumulating ascending channel, where the resistance line remains unchanged, and the support level gradually increases, raising the asset’s price lows. In trading, this model can be found relatively often in any financial markets, including the cryptocurrency market, Forex, the stock market, and commodity markets. Furthermore, the ascending triangle is a chart pattern that is one of the frequently used models and can be applied in day trading.
The appearance of an “ascending triangle” on a chart predicts a potential increase in the asset’s price within a specific range. This pattern is generally more effective in an uptrend, where bullish sentiment and volume are stronger, rather than in a downtrend. The pattern’s higher lows suggest that control is progressively shifting to the bulls, signaling to traders potential opportunities for trading an ascending triangle pattern.
When the price breaks through the upper resistance of the triangle, it significantly increases the likelihood of continued upward movement, particularly if the breakout is confirmed by a retest of the resistance line that then holds as new support, followed by a subsequent upward bounce in price. This breakout occurs when the bullish breakout is confirmed, and the ascending triangle breakout leads to a new phase in price movement.
How to Identify an Ascending Triangle Pattern on a Chart
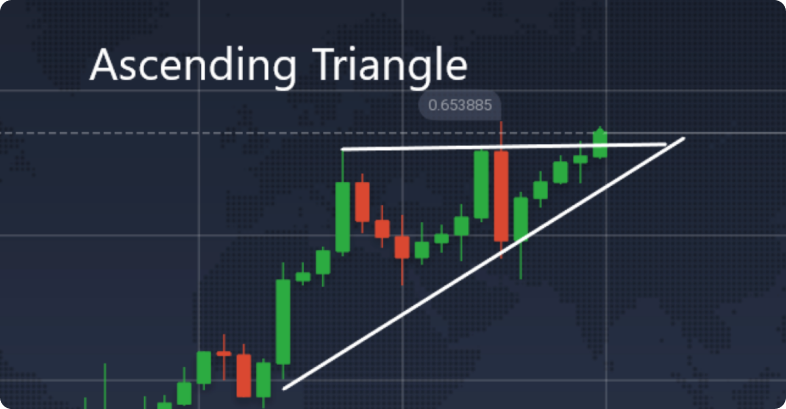
Spotting an “ascending triangle” on a chart is straightforward due to its distinctive shape, which resembles a right triangle lying flat. The formation of an ascending triangle involves observing the line of the triangle and the ascending support line.
To accurately recognize the “ascending triangle” pattern, look for these key characteristics:
- This pattern usually emerges in an uptrend as a continuation pattern, indicating ongoing bullish momentum. It can also appear at the end of a downtrend, suggesting a potential bullish reversal.
- The horizontal resistance line of the triangle should be defined by at least two high points that are roughly at the same level. A lower corrective price should occur between these points.
- The support line should consist of at least two ascending lows, each one higher than the last, which confirms the pattern’s validity.
- While this pattern is more reliable on larger timeframes like weekly or monthly, it can still be effective for day trading or short-term strategies.
- Trading volumes tend to decrease as the pattern forms. Ideally, volume should spike as the price breaks above the resistance, although this isn’t always necessary for the pattern to be valid.
- The pattern is confirmed when there’s a breakout above the horizontal resistance line. Once broken, this line turns into a new support level for the bulls, often retested in subsequent trading.
- The profit target for trades based on this pattern is typically set at a height equal to the widest part of the triangle, added to the breakout point.
These features help traders recognize and leverage the “ascending triangle” for potentially profitable trading opportunities.
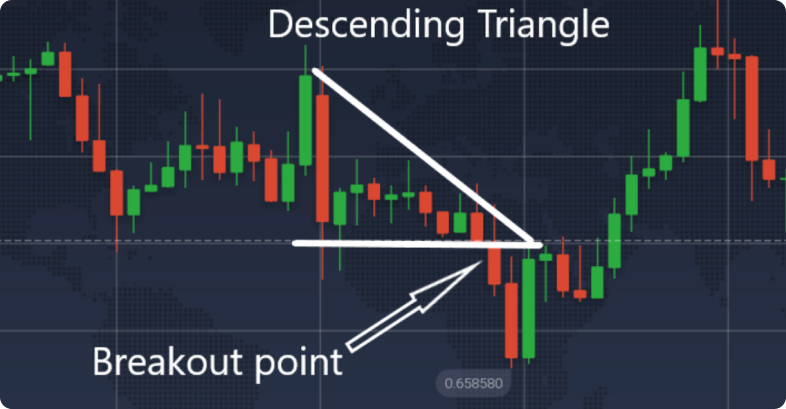
Key Differences between Ascending and Descending Triangles
In technical analysis, chart patterns are essential tools for traders to identify potential breakouts and trend reversals. Two common patterns are ascending and descending triangles. Though they may seem similar, there are crucial differences between them that traders should understand for better trading decisions.
Here are the main differences between ascending and descending triangles:
- Trend Direction:
- Ascending Triangles: Typically occur during uptrends. They form when the price consolidates between a horizontal resistance level and a rising trendline (Read our guide on trendlines and strategies with them).
- Descending Triangles: Usually appear during downtrends. They form when the price consolidates between a horizontal support level and a falling trendline.
- Volume:
- Ascending Triangles: Volume usually decreases as the price approaches the resistance level, indicating trader caution near a potential breakout.
- Descending Triangles: Volume tends to increase as the price approaches the support level, indicating trader aggression near a potential breakdown.
- Breakout Direction:
- Ascending Triangles: Breakouts generally occur to the upside, above the resistance level, due to building bullish pressure.
- Descending Triangles: Breakouts typically occur to the downside, below the support level, due to increasing bearish pressure.
- Target Price Calculation:
- Ascending Triangles: The target price is calculated by adding the height of the triangle to the breakout point.
- Descending Triangles: The target price is determined by subtracting the height of the triangle from the breakout point.
While both ascending and descending triangles are significant patterns, understanding their differences is crucial for making informed trading decisions and enhancing success in the market.
Psychology Behind the Ascending Triangle Pattern
Market behavior often mirrors the psychological state of its participants. The ascending triangle pattern exemplifies this, as bulls push the price toward a formed horizontal resistance. At this juncture, significant selling by bears might cause the price to retract temporarily. Determined to breach this resistance, buyers rally, propelling the price upward akin to bull “horns,” elevating the support level to create progressively higher lows. This escalation results in a showdown between bears and bulls right at the resistance point.
As the price nears this critical line of resistance, trading volumes typically increase, setting the stage for a showdown to determine the dominant market force. Breaking through the resistance signals a bull victory, signaling potential for further upward movement. Conversely, if the price sharply falls, breaking below previous lows, it indicates bear dominance, likely spurred by negative market news or data impacting the asset involved in the triangle formation.
Such scenarios underscore the dynamic interplay of market forces within the framework of the ascending triangle, highlighting its importance in predicting price movements based on trader psychology.
Trading Strategies for the Ascending Triangle Pattern
Let’s explore a traditional trading approach using the “ascending triangle” pattern, illustrated with the daily chart of the AUD/USD currency pair.
Here, the chart displays a bullish pattern characterized by an extended resistance line that the price has bounced off three times. Each time, the lows of the price have progressively risen, establishing a robust support level—this shows the bulls’ determination to surpass the resistance.
On their fourth attempt, the buyers successfully pushed through the resistance upwards. At this stage, it’s advisable to initiate a long position, setting a stop-loss just below the triangle as a risk management measure.
To set a profit target, use the “Price Range” tool on the chart to gauge the maximum potential rise from the breakout point, based on the height of the triangle. Mark this level with a line where you’ll place your take-profit order. This method capitalizes on the predictable movement that often follows the breakout from an ascending triangle.
How to Effectively Use the Triangle Pattern
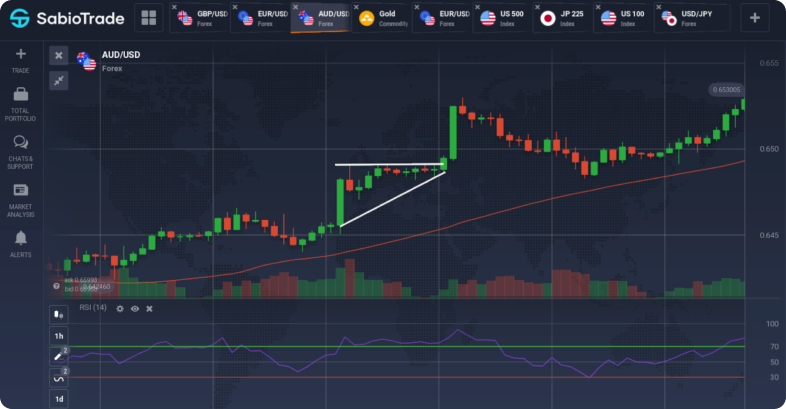
AUD/USD 1H Chart
To minimize the risk of false breakouts or market reversals when using the triangle pattern, traders should employ additional technical indicators. Among the most useful are RSI, volume indicators, and moving averages:
- Relative Strength Index (RSI): This indicator can show when the price is exiting the overbought zone, indicating a potential continuation of the upward movement.
- Volume Indicator: An increase in volume during or after a breakout can indicate genuine interest in buying or selling. If volumes remain low, the breakout might be false.
- Moving Averages (MA): These indicators can be used to determine support and resistance levels and to set trailing stop-loss orders.
It’s important to remember that no technical indicator provides absolute certainty. Therefore, it’s crucial to consider current fundamental factors, news, and macroeconomic data, which can influence significant resistance breakouts and the continuation of an upward trend.
Additionally, don’t forget about trailing stop-loss orders after opening a position. They help protect your position as the price moves upward. However, there’s a caveat: such orders can sometimes close a position prematurely with minimal loss or profit, after which the price may continue in the desired direction.
Pros and Cons of the Ascending Triangle Pattern
Like all trading patterns, the ascending triangle comes with its set of strengths and weaknesses.
Advantages:
- Versatility in Application: This pattern is applicable across various financial markets, including stocks (explore the best stock trading strategies), Forex, cryptocurrencies, and commodities.
- Flexible Timeframe Compatibility: The ascending triangle can form across a range of timeframes, from longer-term to intraday, making it a versatile tool for many traders.
- Beginner-Friendly: The pattern is relatively simple to understand and use, with clear guidelines on entry and exit points, making it suitable for novice traders.
- Basic Analytical Requirements: To effectively trade using this pattern, one only needs to grasp the fundamental aspects of its formation and key characteristics.
Disadvantages:
- Inconsistency in Signals: The ascending triangle doesn’t always produce reliable signals, particularly in downtrends where reduced trading volume can fail to support a bullish breakout, creating potential “bull traps.”
- Long Formation Period: Sometimes, the pattern may take an extended period to develop, which can delay the identification of optimal trading opportunities. Traders might benefit from using pending orders to avoid missing sudden breakouts.
- Risk of Misidentification: Due to its similarity to the rising wedge pattern, there’s a risk of misidentifying an ascending triangle, especially when the ideal formation is not clear, leading to incorrect trading decisions.
Wrap Up
In conclusion, the ascending triangle pattern represents a powerful tool in the trader’s arsenal, enabling them to capitalize on well-defined bullish trends. By meticulously observing the pattern’s development and confirming breakout points with significant volume, traders can enhance their strategic positioning in the market.
However, like any trading strategy, the application of the ascending triangle pattern demands vigilance and a nuanced understanding of market dynamics. Traders must remain cautious, prepared to adjust their strategies based on real-time market data and evolving trends. Importantly, the integration of other analytical tools and indicators can fortify the predictive power of the ascending triangle, providing a more robust framework for making informed trading decisions.
Ultimately, the successful application of the ascending triangle pattern not only requires technical acumen but also an astute psychological understanding of market participants. By harnessing this pattern within the broader context of market behavior and economic indicators, traders can more effectively navigate the complexities of the financial markets, optimizing their trading outcomes while managing risk.
Looking for a Coupon to save on Sabio plans? Visit our coupon page on Wethrift.