All Secrets of False Breakout Trading Strategy


Many Forex traders like to trade around key levels and frequently face false breakouts. It’s safe to say that false breakouts are a common challenge for anyone using this strategy. Key levels are points on the chart where the price has previously bounced or consolidated. Levels below the current price are known as support, and levels above are called resistance. Trading this way helps minimize risks and offers clear points for setting stop-loss and take-profit orders.
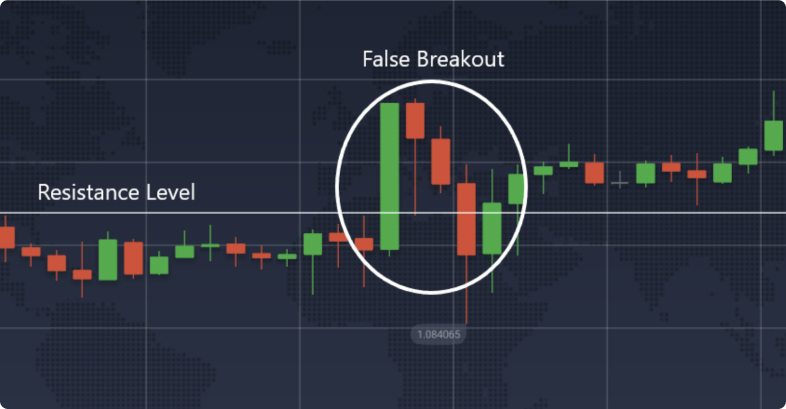
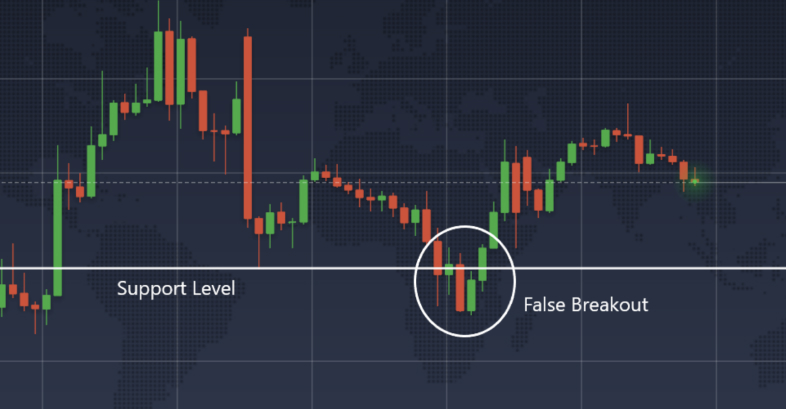
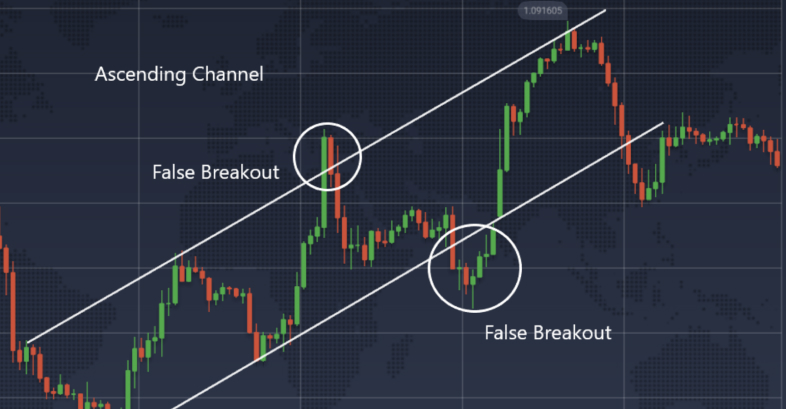
In the market, prices move between support and resistance levels, which can lead to either a breakout or a bounce. False breakouts are a common occurrence in Forex trading. Most traders prefer to sell at the top and buy at the bottom. A false breakout is essentially a trick played on the majority of market participants.
During this phase, the support or resistance is tested. If there are major players ready to move the price in the current direction, a true breakout will occur, continuing the current market trend. However, detecting whether a breakout is genuine or likely to be false can be tricky.
In the case of a false breakout, large players push the price beyond a level, giving the majority a false signal that the price will continue in that direction. Meanwhile, these large players gradually take positions in the opposite direction at more favorable prices. Once they have accumulated the necessary volume, they profit from the stop-loss orders of the majority, as the price rapidly moves in the opposite direction after returning below the level.
Trading a false breakout involves taking a position in the opposite direction of the failed breakout and setting stop-loss orders above or below the consolidation level, depending on the breakout direction. This approach allows traders to use false breakouts to their advantage, turning potential failed breakouts into profitable trading opportunities.
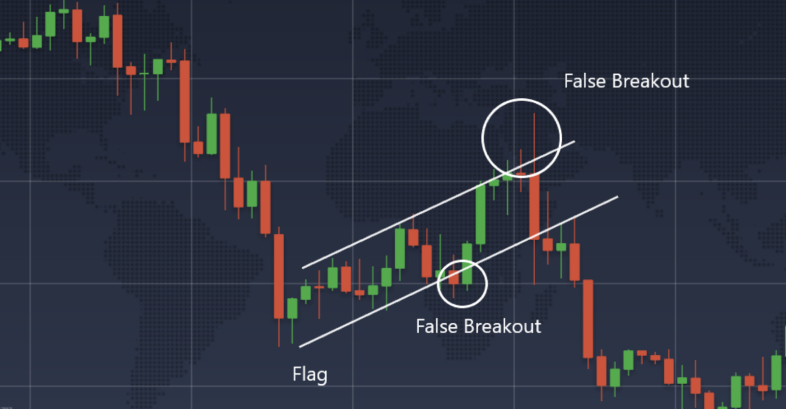
When a beginner starts learning trading, one of the first strategies they often try to master is the breakout trading strategy. Whether it’s a breakout from a range or a chart pattern, the idea of the “breakout” strategy is to capitalize on a strong trend impulse by entering a trade at the beginning of the trend.
“Buy just above previous highs!” – says the basic breakout trading strategy.
The breakout trading strategy makes sense. Sooner or later, a trade using this strategy will be able to yield a significant profit.
However, the challenges are:
Regardless of the type of false breakout (FB) encountered in the market, it is a clear signal for further price movement in the opposite direction. To trade correctly, you should wait for the price to return back under the level. Many traders prefer to wait for a small consolidation of the price near the level.
Buying positions
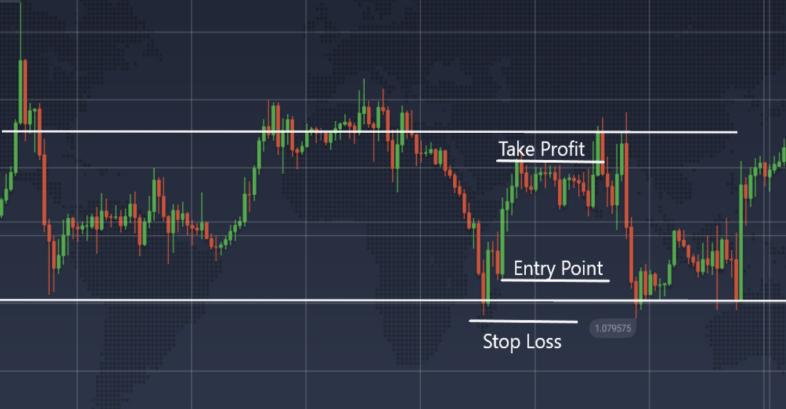
The position is opened in the opposite direction of the false breakout. Then, the stop-loss is placed beyond the level, above or below the consolidation, depending on the market price direction. The take-profit should be set at the nearest level on the chart.
Selling positions
You can also enter a position after a false breakout without waiting for consolidation, using Price Action patterns. In this case, the stop-loss should be placed according to the rules of working with the specific pattern. As in the first case, the take-profit can be set at the nearest level or according to the rules of working with the particular model.
Trading false breakouts can be highly profitable, but it also comes with risks. Effective risk management is crucial to protect your capital and ensure long-term success. Here are some key principles and strategies for managing risk when trading false breakouts:
A false breakout in Forex is a very common signal indicating a change in the direction of price movement. It acts as a kind of trick on the crowd, as many participants jump into a position when a breakout occurs without waiting for its confirmation. As a result, they incur losses because the price changes direction and moves back below the level. At this point, many participants’ stop-losses are triggered, causing the price to sharply move in the opposite direction after the false breakout.
Considering this, it can be confidently stated that a false breakout is a signal indicating a change in the current direction of price movement. To avoid falling into this trap, it is recommended to use VSA (Volume Spread Analysis) or Price Action trading patterns, which help determine the real picture of what is happening in the market. For example, with VSA, if a breakout occurred without significant volume, it is likely to be a false breakout. Additionally, using false breakout trading strategies can help you identify false breakouts and trade them intentionally to your advantage. One of the simplest ways to avoid a false breakout is to wait for confirmation before entering a trade, ensuring the breakout is genuine rather than a false breakout.