A Comprehensive Guide on How to Achieve Mastery of Bearish Harmonic Patterns
Bearish Harmonic patterns are price chart formations that many technical analysts use in financial markets to identify potential reversals from an uptrend to a downtrend. These patterns are usually built on geometric formations and Fibonacci ratios to help traders find bearish reversals, where the buy-side loses momentum and the sell-side gains strength to drive prices lower. These patterns are particularly liked by its users due to their precisive nature, which helps traders define entry and exit points with optimal accuracy.
Although effective, these patterns can be quite tricky to spot–especially for beginners. In this article, we will explore Bearish Harmonic Patterns in depth to understand how they’re formed and how to add them to your trading system.
Understanding Bearish Harmonic Patterns
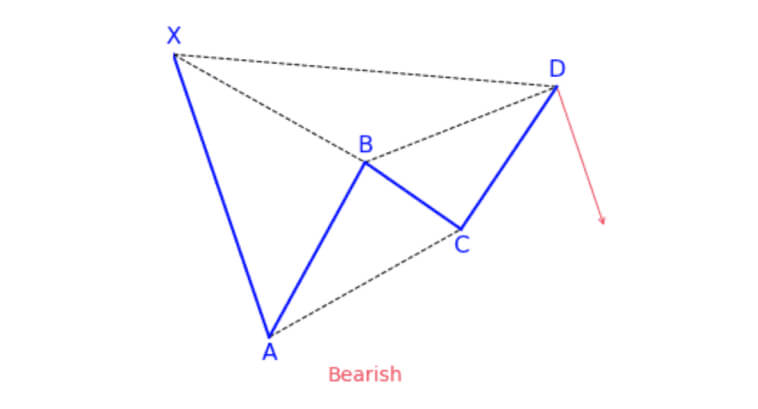
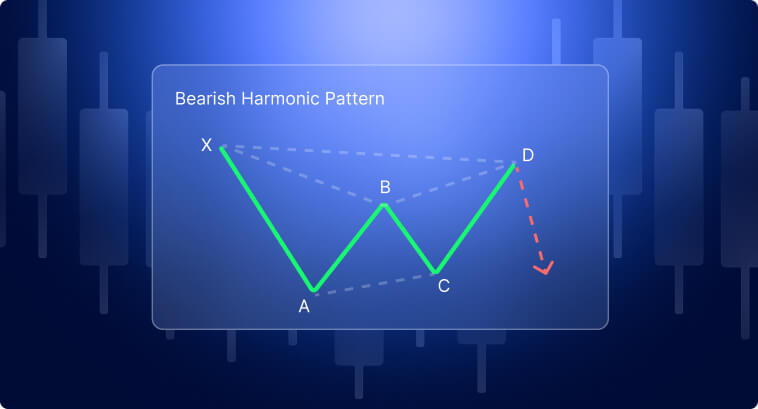
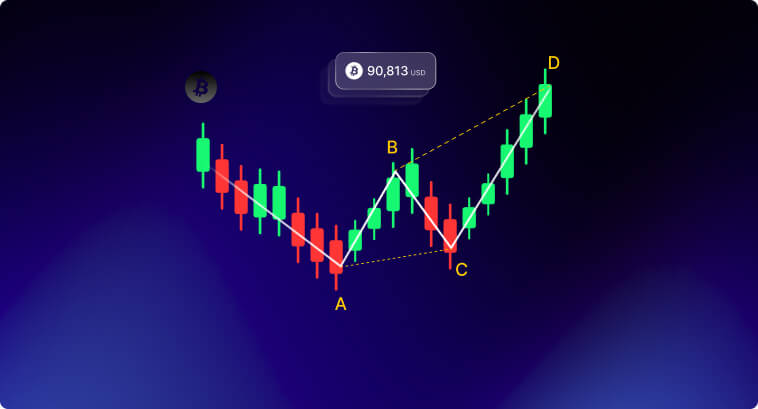
Harmonic patterns, bearish or bullish, are mainly formed by five key points: X, A, B, C, and D.
The way that prices move from one point to another forms several shapes that help technical analysts find entry points, define stop-loss levels, and take-profit levels.
These points are also closely tied to Fibonacci ratios, representing critical price levels that define the relationship between supply and demand.
We can describe these patterns as:
- X to A: The first price movement that establishes the pattern.
- A to B: A retracement of the XA movement. It usually aligns with Fibonacci ratios of 61.8% or 50%.
- B to C: Another retracement that falls within the 38.2% to 88.5% of the price range of the AB move.
- C to D: This is the final “leg” of the pattern. It can retrace between 78.6% and 88.6% of the XA leg, as well as extend between 127.2% or 161.8% of the XA movement.
The D point marks the most important reversal zone of the pattern, where prices are expected to reverse downward in the case of Bearish Harmonic Patterns.
Types of Bearish Harmonic Patterns
Several types of bearish patterns can be used for harmonic trading. It is crucial to understand their main traits to accurately spot an opportunity when it arises on your price chart.
The table below highlights key Fibonacci retracement and extension levels along with their unique features:
| Pattern |
XA Retracement |
AB Retracement |
BC Retracement |
CD Extension |
Key Characteristics |
| Gartley |
61.8% (0.618) |
61.8% (0.618) or 78.6% (0.786) |
38.2% (0.382) to 88.6% (0.886) |
127.2% (1.272) to 161.8% (1.618) |
Resembles an “M” or “W” shape; has the potential to forecast price reversals. |
| Bat |
88.6% (0.886) |
38.2% (0.382) or 50% (0.5) |
38.2% (0.382) to 88.6% (0.886) |
161.8% (1.618) |
Deep retracement; suggests strong reversal potential; extended CD leg. |
| Butterfly |
78.6% (0.786) |
38.2% (0.382) or 50% (0.5) |
38.2% (0.382) to 88.6% (0.886) |
127% (1.27) to 161.8% (1.618) |
Indicates trend reversal; CD leg extends beyond XA leg. |
| Crab |
61.8% (0.618) |
38.2% (0.382) or 50% (0.5) |
38.2% (0.382) to 88.6% (0.886) |
224% (2.24) to 361.8% (3.618) |
Extreme extension in CD leg; suggests a significant reversal. |
How to Identify Harmonic Chart Patterns
There are some principles to adhere to when trading patterns like the Bearish Harmonic Patterns:
- Identifying Key Points: Start by pointing out the points X, A, B, C, and D to draw the main price swings. These are the key highs and lows on the chart.
- Fibonacci Ratios: Measure each leg’s retracement or extension against Fibonacci levels. The AB leg has to retrace 50% (0.50) or 61.8% (0.618) of the XA leg. Some traders do accept a minor deviation of ratios, but that depends on each person’s risk appetite.
- Symmetry: Ensure that the pattern maintains a good sense of proportionality, with no erratic price movements between each leg.
- Confirmation: Additional technical analysis techniques can help you enter a trade more confidently (e.g., trendlines, support and resistance zones, moving averages, and others).
Signs of False Patterns:
- Extreme deviations from the Fibonacci ratios
- Lack of symmetry between legs
- Low trading volume, indicating disinterest from market participants.
Harmonic Patterns Trading 101: Developing Your Strategy
Bearish Harmonic Patterns are based on using Fibonacci ratios to spot reversal points (point D). The entry point is close to the D point. Stop-loss is set just above the D point to avoid false signals. You can use Fibonacci extensions to define profit targets or set points A and C as possible take-profit zones.
Let’s see some examples:
Broadcom Inc. (AVGO)
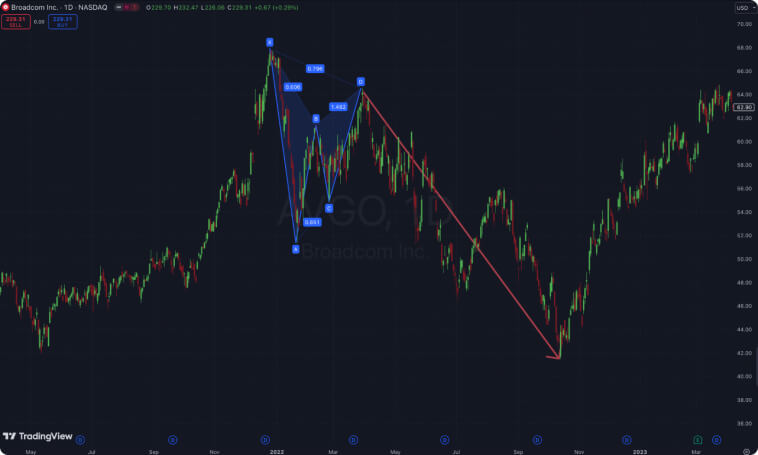
The chart above is an example of a bearish Gartley pattern, which is defined by a sharp trend reversal at point D. The pattern above displays the following structure:
- The AB leg retraces around 60.6% (0.606) of the XA leg.
- The BC leg retraces around 65.1% (0.651) of the AB leg.
- The D point is a 79.6% (0.796) retracement of the XA leg, marking the reversal zone.
The D point is formed by a Candlestick that is similar to a Hanging Man figure, followed by a bearish candlestick. The entry point could be right below the bearish candle that appears next to the Hanging Man. The stop-loss order should be placed slightly above the Hanging Man’s high, while take-profit levels can be placed at the same price levels as points C and D or extensions of the CD leg (e.g., 61.8% or 100%)
The daily timeframe provides more confidence in the reliability of the pattern and makes it more suitable for swing trading. In shorter timeframes, especially intraday, harmonic patterns tend to be less reliable due to the extra noise that comes with shorter-periods price action.
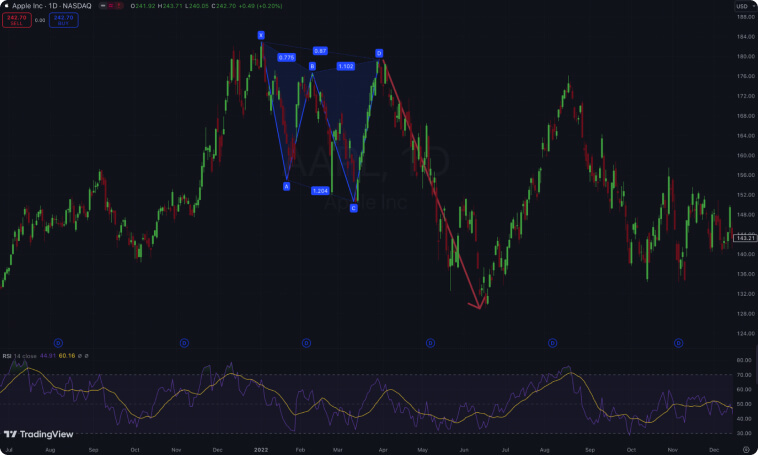
Apple Inc. (AAPL)
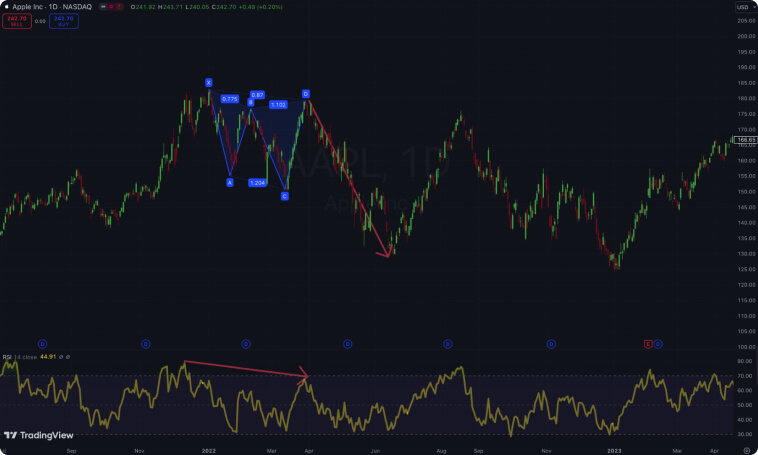
The Apple chart above presents a Bearish Pattern with the following setup:
- The AB leg is a 77.5% (0.775) retracement of the XA leg
- The BC leg is an extension of 120.4% (1.204) of the AB leg
- The D point is positioned at an 87% (0.870) retracement of the XA leg.
In this case, it is interesting to highlight how additional indicators can be used alongside harmonic patterns. The RSI points to weakening bullish momentum with its lower highs, indicating that prices may be close to a reversal point.
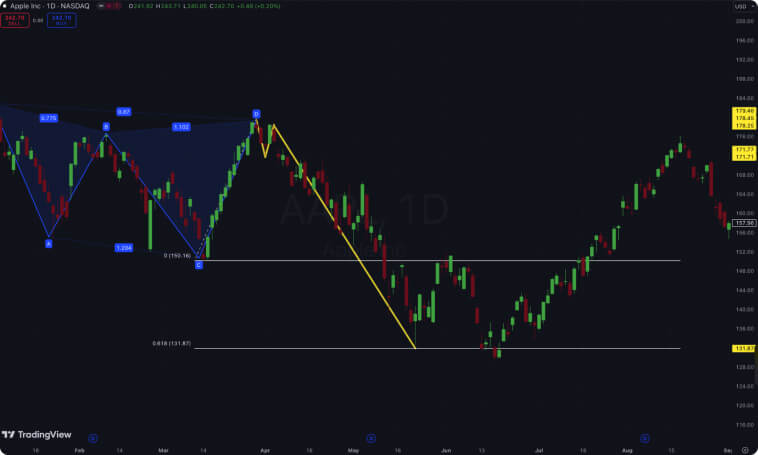
The ideal selling order should be placed just below the D point, especially when there’s a small bearish pivot around it, as highlighted in the image below. The stop-loss order should be placed slightly above the D point, and profit levels can be set at points A, C, or Fibonacci extensions of the CD leg, especially 61.8% and 100%.
Risk Management
Even though Harmonic Patterns are powerful, they are a bit challenging to identify and measure, especially for beginners. It requires a trained eye, a strong understanding of price movements and cycles, as well as careful practice to find and enter trades confidently when adding these patterns to your trading system.
For those who are just starting out, the complexity of harmonic patterns and their Fibonacci ratios can make it hard to distinguish between valid patterns and random price fluctuations. Good advice would be to look for structures resembling Ms and Ws on price charts, as most Harmonic Patterns form shapes that resemble these letters.
To avoid blowing up your trade account on unreliable patterns and false signals, follow strict risk management. Never risk more than 2% of your total account in a single trade. Before diving into live markets, practice on demo accounts and keep a trading diary to highlight your successes and failures and what elements took you towards success or failure.
Psychologically, understand that most traders are driven by fear, greed, and FOMO (Fear of Missing Out). Build a consistent and strong trading plan, practice on demo accounts, adjust the trading plan according to your results in a practice environment, and only then trade in live markets. Once you’re risking true capital, stick to the trading plan and don’t deviate from it unless you backtest another plan. Trading Harmonic Patterns requires mental discipline!
From Forex Market to Stock Market: Applications in Different Conditions
To effectively add harmonic patterns to your trading system, you have to understand the nuances of each market you participate in.
Markets come with unique features like liquidity, volatility, trading volume, and many others that can influence the applicability of bearish harmonic patterns. To avoid losses and enjoy the maximum capacity of these patterns, you must understand and adapt your approach to fit the specific conditions of each market below, considering these main features:
- Stock Markets: Price movements tend to be a bit slower and patterns tend to be quite reliable.
- Forex Market: High liquidity and frequent trend reversals make it extremely suitable for harmonic patterns. Make sure that you are also familiar with how to read currency trading charts and some of the best Forex trading strategies.
- Cryptocurrency: Volatility also favors harmonic patterns, but you must be extra cautious with risk management.
Keep in mind that volatile markets require wider stop-losses. Focus on instruments with higher liquidity and trading volume.
Practical Recommendations
I’ve outlined below some essential tools and strategies to improve your chances of success when trading with Bearish Harmonic Patterns. I consider these practices to be vital for building consistency and fine-tuning your skills over time.
- Confirm Fibonacci ratios before trading. Avoid ratios that deviate largely from the extensions and retracements ratios expected for each pattern.
- Always verify symmetry and proportionality. Bearish Harmonic Patterns tend to have a W-like shape.
- Use additional indicators to support the pattern.
- Use Platforms that allow you to easily draw and measure Fibonacci ratios, like TradingView–one of the best platforms in the industry, check the best TradingView indicators for day trading.
- Maintain a log of trades to analyze past performance and refine strategies.
- Backtest patterns on historical data and learn from past mistakes.
Conclusion
Bearish Harmonic patterns are a sophisticated but accessible tool for those who are looking to step up their trading system. These patterns provide a lot of insights into market dynamics and price cycles.
With consistent practice and adherence to the best practices, they effectively enhance your performance, profitability, and confidence. Risk management, psychological strength, and technical skills are among the top priorities to master trading with these patterns.