Forex, Stocks, Crypto: How to Trade Harmonic Patterns Like a Pro
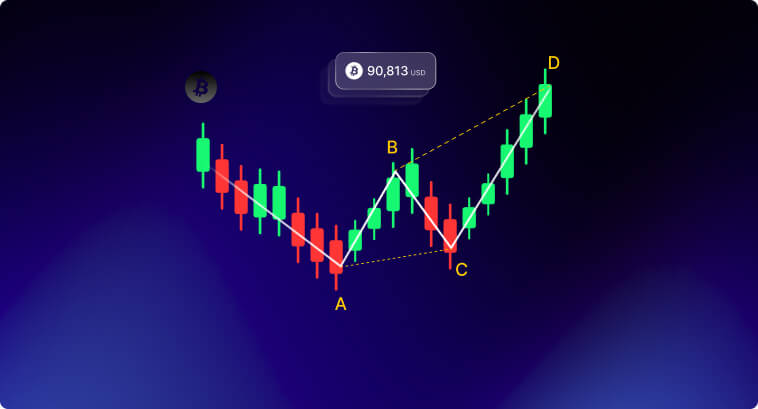

Harmonic patterns are among one of the most advanced techniques in technical analysis. These patterns allow traders to develop trading strategies for predicting future price movements through repetitive geometric configurations in price charts.
Most of these trading patterns are linked to the Fibonacci sequence, a mathematical progression in which each number is the sum of the two numbers prior (for example, 0, 1, 1, 2, 3, 5, 8, 13, etc.). This sequence gives us important ratios, such as 0.618 and 1.618–often referred to as the Golden Ratio and widely seen across nature, architecture, and artworks.
These ratios can be applied to trading to measure retracements and extension levels, forming the basis and validation of harmonic price patterns.
Traders and investors use harmonic patterns to study market symmetry and anticipate potential price reversals, as well as continuation phases in price charts. Many believe that the relationship these complex patterns have with Fibonacci retracement and extension levels reinforcers their power to reflect the inherent nature and rhythm behind market behavior.

Harmonic patterns are built on the principles of the Fibonacci sequence and the golden ratio–1.618.
The Fibonacci sequence was first introduced by Italian mathematician Leonardo of Pisa–also known as Leonardo Fibonacci or simply Fibonacci–in his 1202 book Liber Abaci (Book of Calculation).
Leonardo introduced the Fibonacci sequence as a numerical progression in which each number is the sum of the two preceding numbers, and he also noticed that this sequence reflected patterns observed all over natural phenomena, such as the arrangement of petals in flowers, the spirals of a shell, and even the proportions of the human body.

In financial markets worldwide, traders and investors have been using the golden ratio and the Fibonacci numbers to measure retracements and extension levels. These numbers can pinpoint relevant levels where prices might find support and resistance, giving market players the chance to identify reversal zones and predict other price movements.
1 – Fibonacci Ratios: Every harmonic pattern is made up of Fibonacci ratios. These ratios are used to measure and highlight the retracement and extension price zones within the pattern. They are:
2 – Price Swings and Key Points: Most harmonic patterns consist of five key points that receive a label from X to D, where each label represents different price swings. All these points are connected to form the pattern.
Each one of the points above represents an important high or low on the price charts, and the legs they create (XA, AB, BC, CD) are a reflection of different price movements and trends within the pattern.
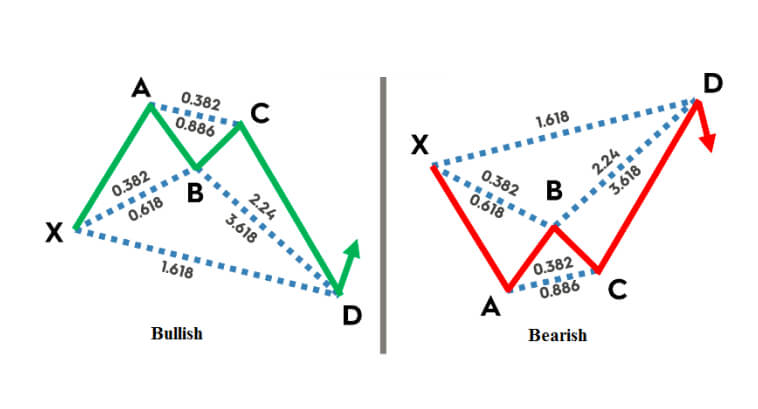
These points and legs are behind the creation of the key harmonic patterns we will explore below, each with its own set of rules and intricacies. It is important to maintain a certain level of accuracy when measuring retracements and extensions between these price points to ensure the validity of the patterns. Large deviations from the ratios mentioned tends to generate unreliable signals and invalid patterns.
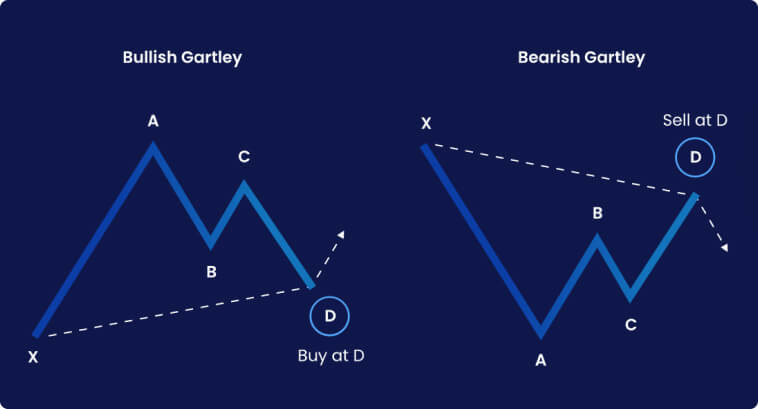
First introduced in the 1935 book Profits in the Stock Market by H.M. Gartley, the Gartley pattern is considered the most foundational pattern in Harmonic Pattern trading. The XABCD points can form either a bullish pattern or a bearish pattern where each leg has the following attributes:
The entry point would be at the D point, where you would go long if it’s a bullish Gartley or short if it’s a bearish Gartley. A stop-loss would be slightly below or above the D point, depending on whether the pattern is bullish or bearish.
Take-profit levels can be set according to certain retracement levels, such as the CD leg’s 61.8% or 38.2% retracements.
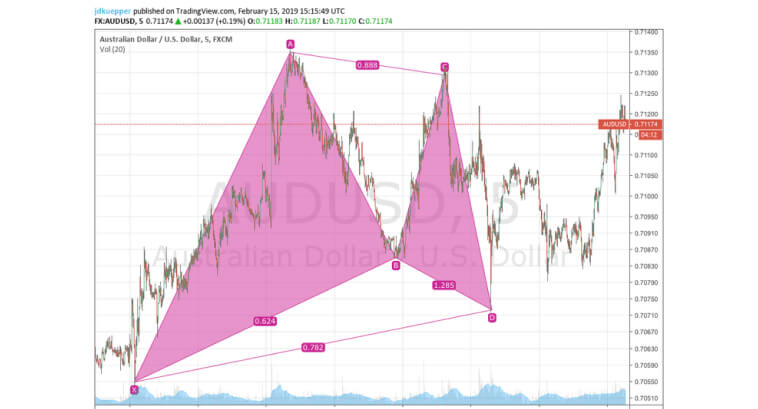
The image below shows an example of the bullish Gartley pattern on a 5-minute AUD/USD currency pair chart. In this example, you could go long on point D, with a stop-loss set right below it–or below point X–and a take-profit set at point C or in key retracement levels of the CD leg.
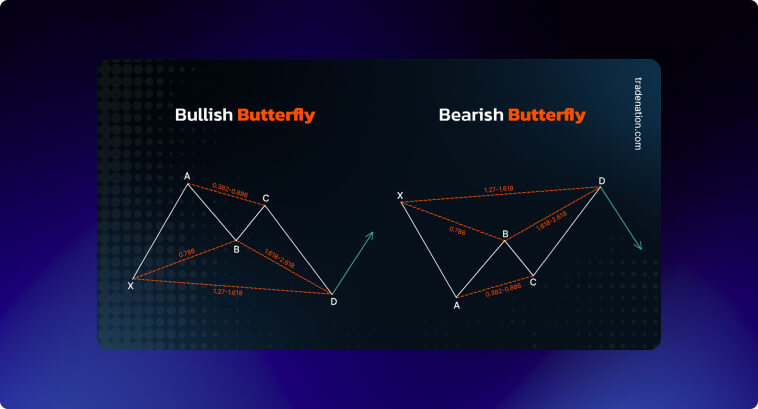
The Butterfly pattern is particularly known for its deep retracement of the XA leg, where the D point goes beyond the X point. Due to its deeper extension, this pattern is believed to generate even more explosive movements than the Gartley pattern. Both the Bullish Butterfly and the Bearish Butterfly pattern exist.
The key ratios for this pattern are:
The stop-loss level should be placed slightly below the D point for the Bullish Butterfly and slightly above the Bearish Butterfly pattern.
The image below contains an example of the Bearish Butterfly pattern on the daily EUR/JPY currency pair chart. Even though the ratios for the legs aren’t textbook examples, some traders wouldn’t mind a ±5–10% tolerance for the Fibonacci ratios—though this depends on your overall risk appetite.
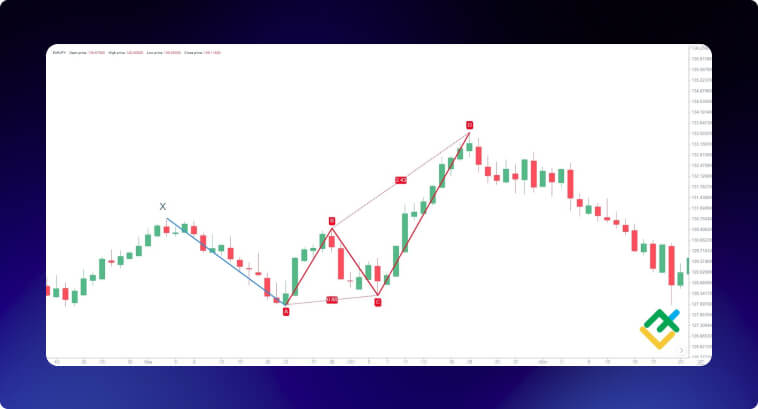
In this specific example, the entry point could be at the low of the red candle right after the D point, with take-profit levels around the C and A points.
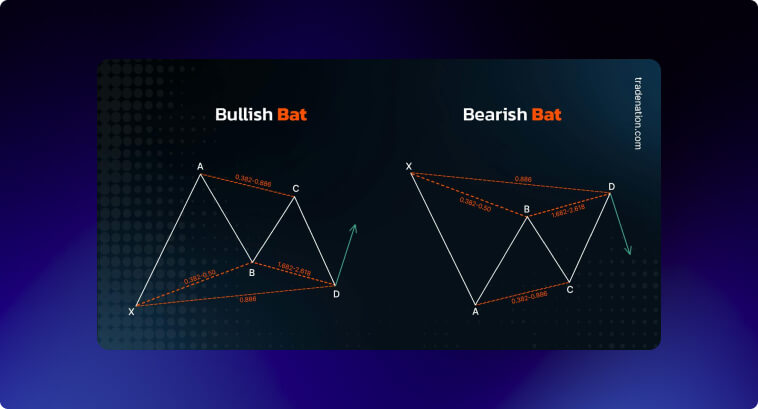
The Bat Pattern was first developed by Scott Carney. It emphasizes a precise B point that retraces at the 0.382 or 0.50 level of the XA leg. It is often considered a more precise pattern than the Gartley pattern due to its very specific retracement level for the B point.
The Bat Pattern’s key ratios are:
The entry-level would be near D, given the alignment with a 0.886 retracement of XA. The take profits would be around 0.382 or 0.618 retracements of the CD leg or even further toward the C or A points.
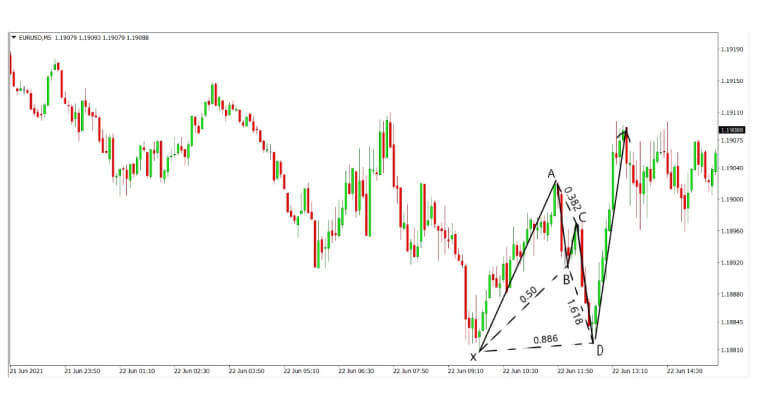
The image above displays an example of a Bullish Bat pattern on the 5-minute EUR/USD currency pair price chart. You can notice the precise 0.50 retracement level of the XA leg at point B and a 0.886 retracement of the same XA leg at point D.
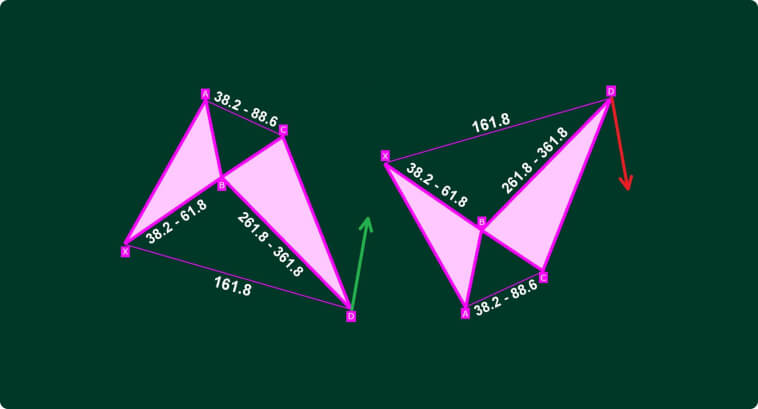
The Crab pattern is distinguished from other patterns due to its D point reaching 1.618 projection of the XA leg. It is also believed to point out sharp reversals in price trends and tends to be more common in volatile markets like Forex.
The Crab Pattern’s key ratios are:
In his Harmonic Trading: Volume One book, Scott Carney–the creator of the Crab Pattern–says that this pattern offers the most extreme price action and dramatic reversals of all the harmonic patterns due to its extreme levels of projections.
Given the volatile nature of this pattern, stop-loss levels should be placed slightly below or above point D, depending on whether you’re trading a Bullish Crab pattern or a Bearish Crab pattern. Take-profit levels should be around the C and A points or even 1.272-1.618 extension levels of the CD leg.
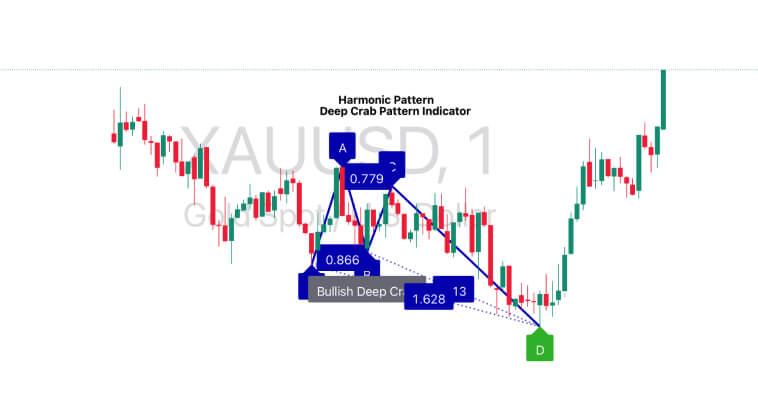
The image above displays the Bullish Deep Crab pattern, a variation of the Crab pattern where the B point retraces much deeper to 0.866 of the XA leg. You can also see how prices revert back to the A point, where a brief resistance is met until prices keep rising in quite an explosive way.
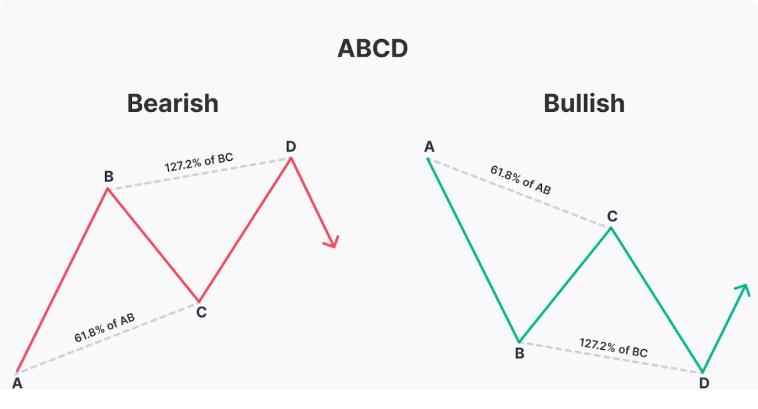
The ABCD pattern is the most simple harmonic structure, consisting of two legs with similar length and direction (AB=CD) connected by a retracement leg BC. This pattern can be used to identify continuation or reversal price movements.
Its key ratios are:
The entry level would be around point D, with take-profit levels at points C, A, or Fibonacci extensions of the CD leg.
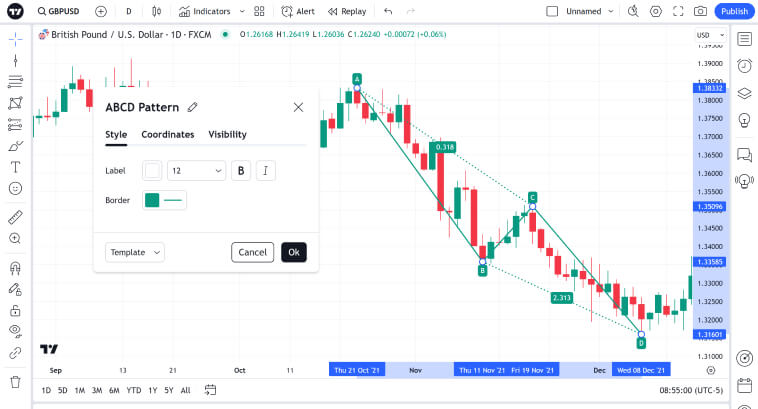
Below, there is an example of a Bullish ABCD Pattern that forms on the daily chart of GBP/USD. Although Fibonacci levels are not textbook examples here, some traders might accept a certain degree of deviation of these ratios given the subjectivity of trading harmonic patterns.
Although harmonic patterns trading can be an effective strategy, finding patterns like these on a price chart can be quite tricky. Correctly identifying and measuring Fibonacci levels of price lags can be especially hard for beginners.
TradingView has some indicators that are designed to autonomously identify and draw harmonic patterns on price charts, like the ABCD Harmonic Patterns by ar_volumetrader and the Gartley Harmonic Pattern [TradingFinder] Harmonic Chart patterns by TFlab. Even though these tools are not 100% effective, they can be helpful for beginners to acquire the skills necessary for spotting harmonic patterns on price charts.
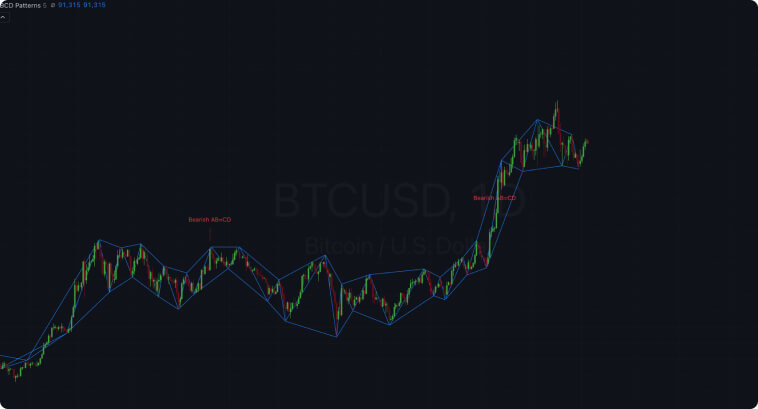
To reduce errors and train your eyes for harmonic patterns, choose a trading platform that allows you to use autonomous systems to identify and draw patterns. Select a timeframe that aligns best with your strategy and risk appetite. Even though harmonic patterns can be seen across different timeframes, shorter timeframes are known for a higher degree of market noise, which only makes it more challenging to spot and validate chart patterns. If you’re a beginner, I recommend sticking to longer timeframes like daily or weekly for more reliable geometric price patterns.
TradingView also allows you to use Fibonacci extension and retracement to measure the legs of the pattern and check if they align with the harmonic ratios. When the completion of the pattern happens at point D, you can plan your trade by setting a clear entry rule, stop-loss, and take-profit levels.
Risk management in trading is extremely important for long-term success. Never risk more than 1-2% of your trading account on a single trade. You can use additional tools for confirmation to enter a trade with more confidence. Trendline analysis, support and resistance levels, as well as technical indicators like the RSI, can help you identify key points of price reversals, allowing you to identify zones where prices are more likely to change direction. Once you’re in, manage your position by adjusting stop-losses, securing profits while allowing the price to move more favorably to your position.
One of the most common mistakes is misidentifying Fibonacci levels and XABCD points, leading to the illusion of seeing patterns where none actually exist–similar to seeing figures in the clouds. For this reason, beginners should focus on longer timeframes and less volatile assets to start harmonic patterns trading. Autonomous tools to identify and draw patterns are also highly encouraged.
Never neglect risk management and always define stop-losses before entering a trade. Risk only 2% of your account at maximum and do not jeopardize your trading account in one single trade.
Additional technical analysis tools can help you enter a trade with more confidence. RSI and Stochastic indicators can help you define overbought and oversold levels, where trend reversals are more likely to occur. Moving averages and trendlines allow you to identify the winning force in the Bulls vs. Bears struggle, giving you the chance to align your entries with the stronger side. Trading volume is an indicator you should always have on your price charts, as lower trading volumes suggest low interest and erratic price action.
Establish a well-defined trading system, preferably built on backtesting, and stay disciplined to it. Keep a check on your emotions and avoid placing trades based on impulsive sentiment, especially fear and greed. Stick to your rules and remain consistent with the plan.
Harmonic patterns are among the most complex and advanced techniques in technical analysis. These patterns are directly related to Fibonacci ratios to measure and predict price behavior. While many traders found success by using the signals these patterns provide, their complexity might make them not very suitable for beginners. Even though indicators on TradingView can help you identify them, relying solely on these tools without understanding the intricacies behind harmonic trading can lead to misinterpretation and losses.
For more experienced traders who are comfortable with detailed chart analysis and validation, harmonic patterns trading can offer a good addition to established trading systems. Combining these patterns with relevant RSI levels and points in trendlines can help you define more precise entry points and zones where the struggle between the buy-side and sell-side may intensify.
For beginners, it is probably a good idea to start with simpler techniques before transitioning to harmonic patterns, acquiring the skills and confidence needed to start employing more advanced strategies.