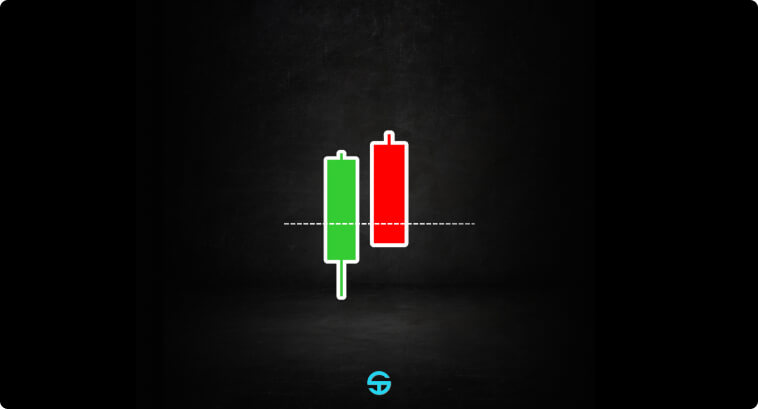
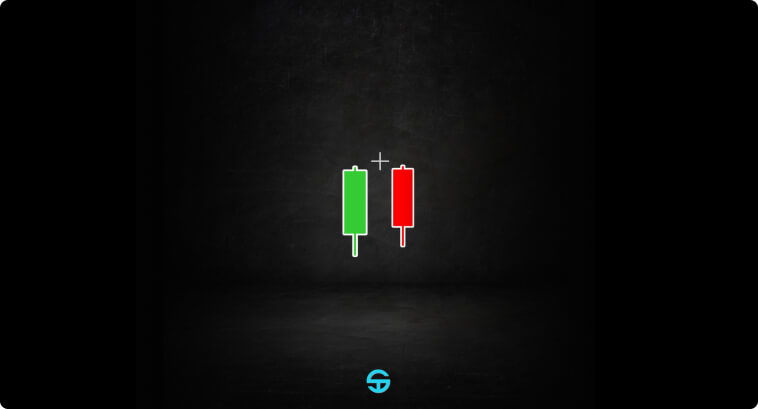
Bearish Harami

The Bearish Harami pattern is characterized by a large bullish candle that is followed by a much shorter bearish candle that is completely placed within the body of the first candle. This structure indicates a clear pause in the bullish rally, potentially indicating signals of a shift in momentum. It is considered less forceful than the Bearish Engulfing, for example, with a success rate of around 50-60%.
Triple Bearish Patterns
Evening Star
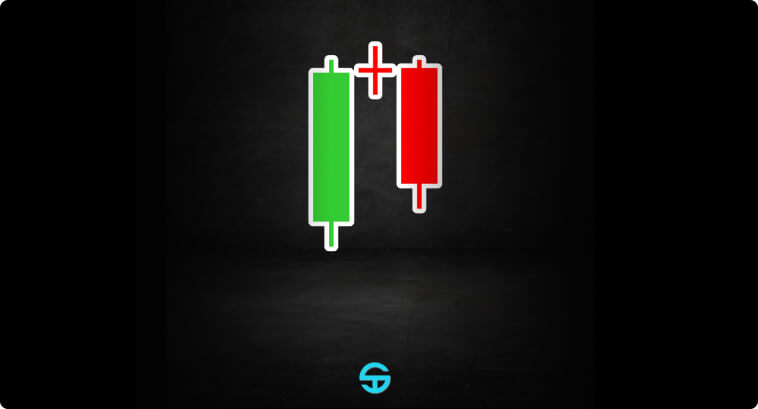
The Evening Star is a 3-candle pattern that is formed by a long bullish candle, followed by a small-bodied candle that gaps up and finishes with a long bearish candle that closes well into the body of the first candle. The gap before the third candle, which confirms the reversal, indicates strong indecisiveness in the market, suggesting that bulls were met with a strong bear force willing to push prices lower. If you look closely, you will notice that this pattern resembles the Shooting Star at a micro level. Some studies indicate its success rate is anywhere between 55% and 69%.
Three Black Crows
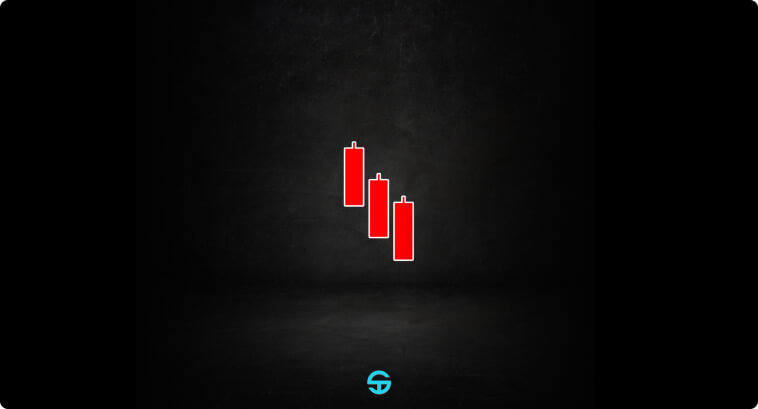
The Three Black Crows are formed by three consecutive red candles that progressively close lower than the previous close. It indicates a sustained level of selling pressure, which can be highly indicative of a market shift when it appears amidst a bullish trend. It is considered a powerful reversal pattern, with success rates ranging from 68-78%.
Evening Doji Star
The Evening Doji Star is another pattern formed by three candles. It is similar to the Evening Star pattern, but it obligatory has a doji as the middle candle (i.e., a candle in which the closing and opening prices are roughly the same). The doji indicates an even greater indecision in the middle candle, indicating that bulls and bears had the same strength during the formation of the candle that marked the peak of the uptrend. Some studies suggest that the doji slightly increases the success rate of the Evening Star, placing it somewhere between 58-70%.

To trade bearish candlestick reversal patterns effectively, you must use additional tools to confirm signals. Volatility indicators like RSI and MACD are useful in identifying whether the current trend is losing strength or if prices are under exhaustion conditions (overbought or oversold levels). Classic Technical Analysis methods of drawing trendlines and marking support and resistance levels are also encouraged, as they become highly significant when a reversal pattern appears around them.
For risk management, you should wait until the reversal pattern is fully formed and confirmed by subsequent price action before entering the market. In the case of bearish reversal patterns, stop-losses placed slightly higher than the peak of the pattern are also encouraged to protect your capital if bears fail to bring the market down. For better trade management, use trailing stops to protect your profits, ensuring a winning trade will not turn into a losing trade. Gradually scale your positions as the downtrend gains traction and momentum, avoiding being caught in a bear trap with a full hand.
The best trading platforms, like TradingView, will offer a wide range of indicators to help you identify and highlight candlestick patterns. For beginners, using these is highly beneficial. Let’s take a look at some real-world scenario examples:
British Pound / U.S. Dollar (GBP/USD) – 1d
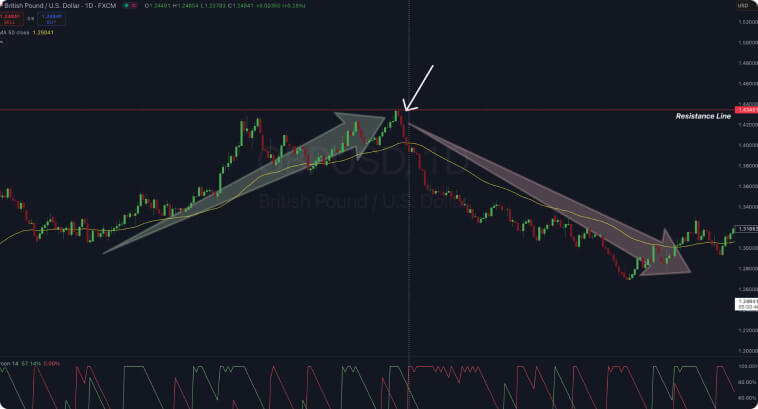
The example above shows a confluence between candlestick pattern trading and technical analysis. We first identify that prices are moving upward since they are trading above the 50-period Exponential Moving Average. We can then identify the formation of the Three Black Crows pattern when the market tries to break the previous peak at 1.43. A bearish formation that immediately appears after a failed attempt to break the previous high is already an alert sign – traders that are more risk-prone could start building their short position here. As soon as the red line crosses above the green line on the Aroon indicator (marked by the white vertical dotted line) and prices start trading below the 50-EMA, we have a confirmation that bears have taken over the market, meaning we can go short. An entry point could be at around 1.38 with a stop-loss order at 1.45 in case bulls regain control.
Apple, Inc (AAPL) – 1d
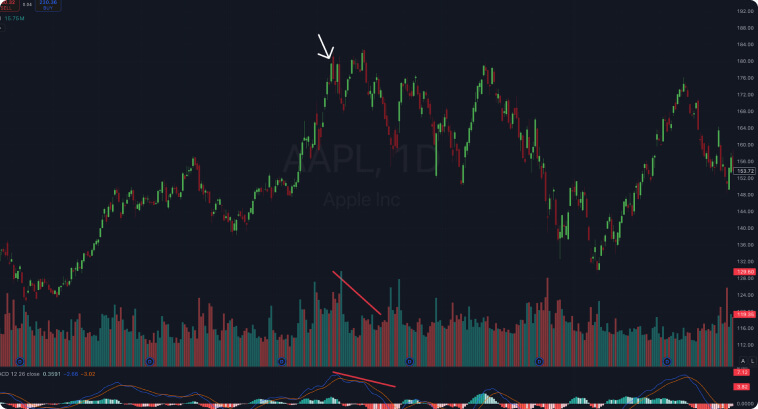
In this example, we have a Dark Cloud Cover appearing at the peak of an uptrend. You notice that, although the pattern was formed, the market still tried to make a new high, but bulls failed to do so. You can notice that the attempt to break higher than the first peak lacked volume, and a divergence appeared on the MACD indicator. These are both signs that bulls are losing the battle, and prices may be in for a dip.
Identifying Common Mistakes and Fixing Them
Even the most experienced traders can fall prey to common pitfalls when using bearish reversal patterns to trade. A frequent error that experienced traders and beginners may fall into is relying solely on the patterns without taking into consideration the full market context.
The table below contains some of the most common pitfalls, along with the details that are often overlooked and a remedy to avoid them. You can use this table as a guide to systematically check your analysis before opening an entry order.
| Mistakes |
Often Overlooked Detail |
Remedy |
| Ignoring Trend Context |
Failing to check for multi-timeframe trends and the overall market sentiment can lead to false signals. |
Enhance your analysis by checking multiple timeframes. You can combine Weekly and Daily charts to identify the major trends on the Weekly chart and use the Daily chart to find optimal entry points and signs. You can also use different indicators on each timeframe to improve your trading system. |
| Ignoring Volume |
Failing to identify major shifts in volume trends and divergences. |
Analyze both the absolute volume spike and the trend of trading volume. Indicators like OBV can help you verify whether the signal you see in the price is backed by a large participation from market players. |
| Premature Entry |
Jumping into a trade before the candle closes or immediately after the pattern’s formation can lead to false breakouts. |
Always wait for confirmation, especially if you’re a beginner and take risk management seriously. Corroborate the position with a momentum indicator before opening your entry order and let the market evolve for a while after the pattern is formed. Sometimes, you may end up losing some opportunities for doing this, but it is still better than losing money due to false signals. |
| Overreliance on a Single Indicator |
Trusting the candlestick pattern without confirmation from additional techniques and tools. |
Combine candlestick analysis with classical Technical Analysis methods (i.e., trendlines, support/resistance levels) and modern Technical Analysis tools (i.e., RSI, MACD, moving averages) to form a more complete view of the market. |
| Confirmation Bias |
Misinterpreting ambiguous signals to fit your expectations instead of an objective analysis. |
Create a checklist for each trade. Be sure to verify the trend, structure, volume, and indicators before opening an entry order. |
| Overfitting Historical Data |
Assuming that past results guarantee future results. |
Always backtest your strategies on different market conditions and timeframes. Stay flexible and update your trading system according to the changes in market dynamics |
Conclusion
Bearish reversal candlestick patterns have been used for decades for anticipating market reversal, helping traders profit from market shifts and protect their capital. Each pattern, regardless of complexity, allows you to have a deeper interpretation of market dynamics and the battle between the buy side and the sell side.
Before jumping straight into the market, practice on demo accounts, keep a trading journal to track past performance, adapt according to shifts in the market, and build a checklist before each trade. Always be mindful of risk management, as that is extremely important to protect your capital.
Candlestick patterns are just a small part of price chart pattern formation. There is a large world of continuation and reversal patterns to explore, from flag patterns to harmonic patterns. You are highly encouraged to learn more about these patterns to further expand your chart reading skills.