How to Choose an Indicator for Your Trading Style
The right indicator for your trading depends heavily on timeframe and goals. Choosing the best set of indicators and tools requires matching their sensitivity to your own personal trading style.
For scalping, which relies heavily on small price changes on short timeframes, usually 1 to 5 minutes, indicators must be highly sensitive, usually with custom settings to capture the intricacies of extremely-fast price action.
Considering intraday trading in longer timeframes, 5 to 30 minute charts, a more balanced approach is needed. You can either use indicators with their standard settings, or slightly tweak them. Many day traders also like to use the VWAP indicator. This indicator marks the average price an asset has traded throughout the day based on volume. When prices are above the VWAP, traders see it as sing that the market is bullish for the day. When prices are trading below it, the market is considered to be bearish.
Many options traders, however, tend to evaluate the market from a swing trading perspective, meaning positions are held for several days to weeks with the goal of capturing larger market trends while removing the short-term noise. With swing trading, most indicators can definitely be used with their standard settings, some may benefit from longer-term custom settings as well, depending on the trading system.
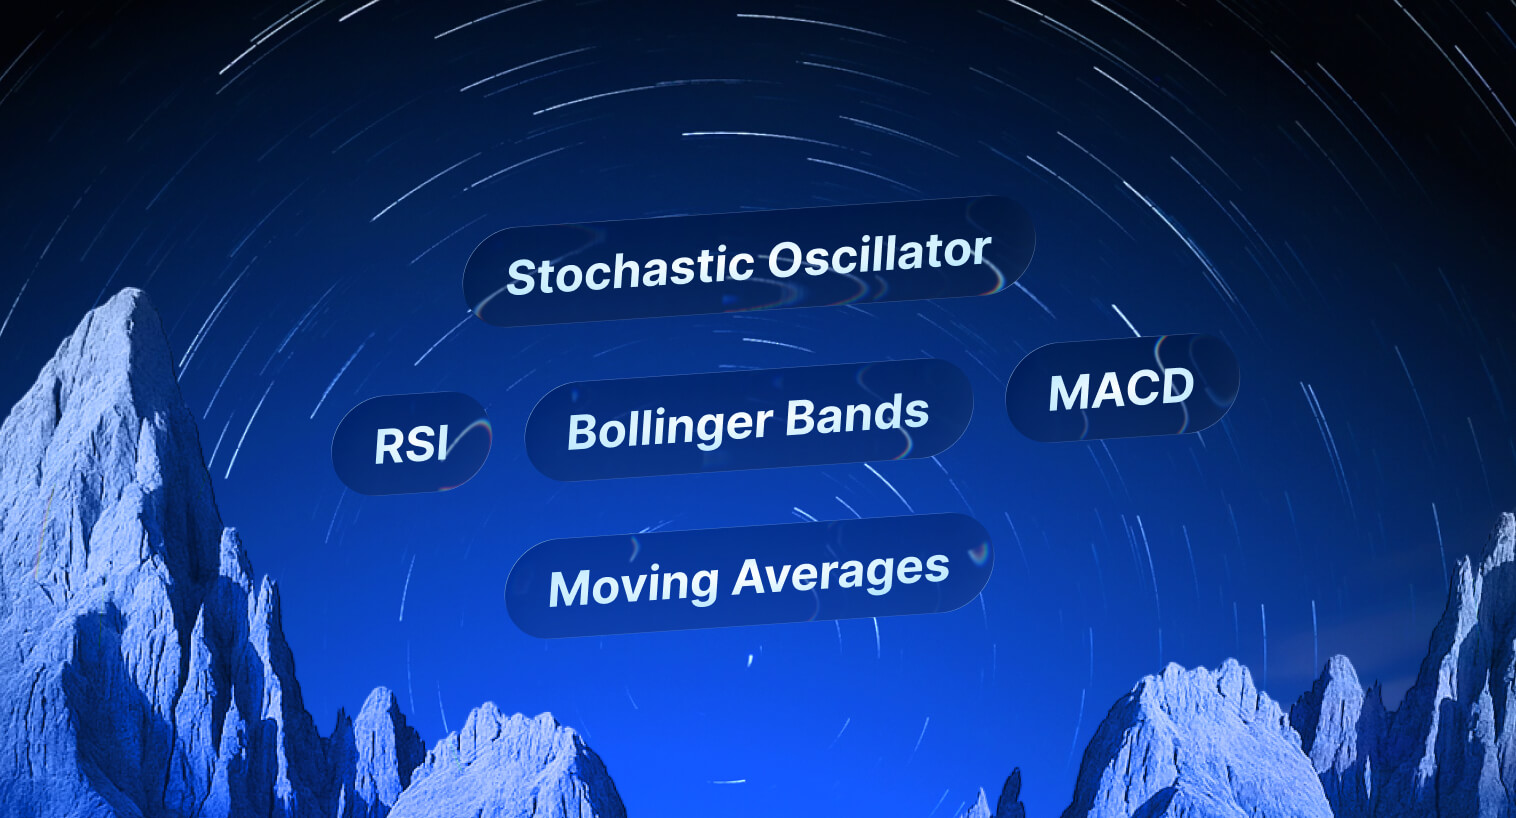
Below, we have a comparative table that may help you understand the differences between different time horizons, timeframe and parameters for some of the most widely-used technical indicators across markets.
| Trading Style |
Timeframe |
RSI |
MACD |
Bollinger Bands |
| Scalping |
1-5 minutes |
7-9 period. Use 90/10 levels for extremes |
3-10-16 or 5-12-9 |
10 period, 1.5 std dev |
| Day Trading |
5-30 minutes |
9-14 period. Use 75/25 levels |
12-26-9 |
20 period, 2 std dev |
| Swing Trading |
4 hours – Daily |
14 or 21 period. Use 70/30 levels |
12-26-9 |
20 or 50 period, 2 std dev |
How to Combine Multiple Indicators to Find Entry and Exit Points
You must not rely on a single indicator to trade. A robust trading system is created by using multiple indicators together. You filter out noise by initializing a trade only when many non-correlated indicators confirm the same market hypothesis.
Some powerful combinations include:
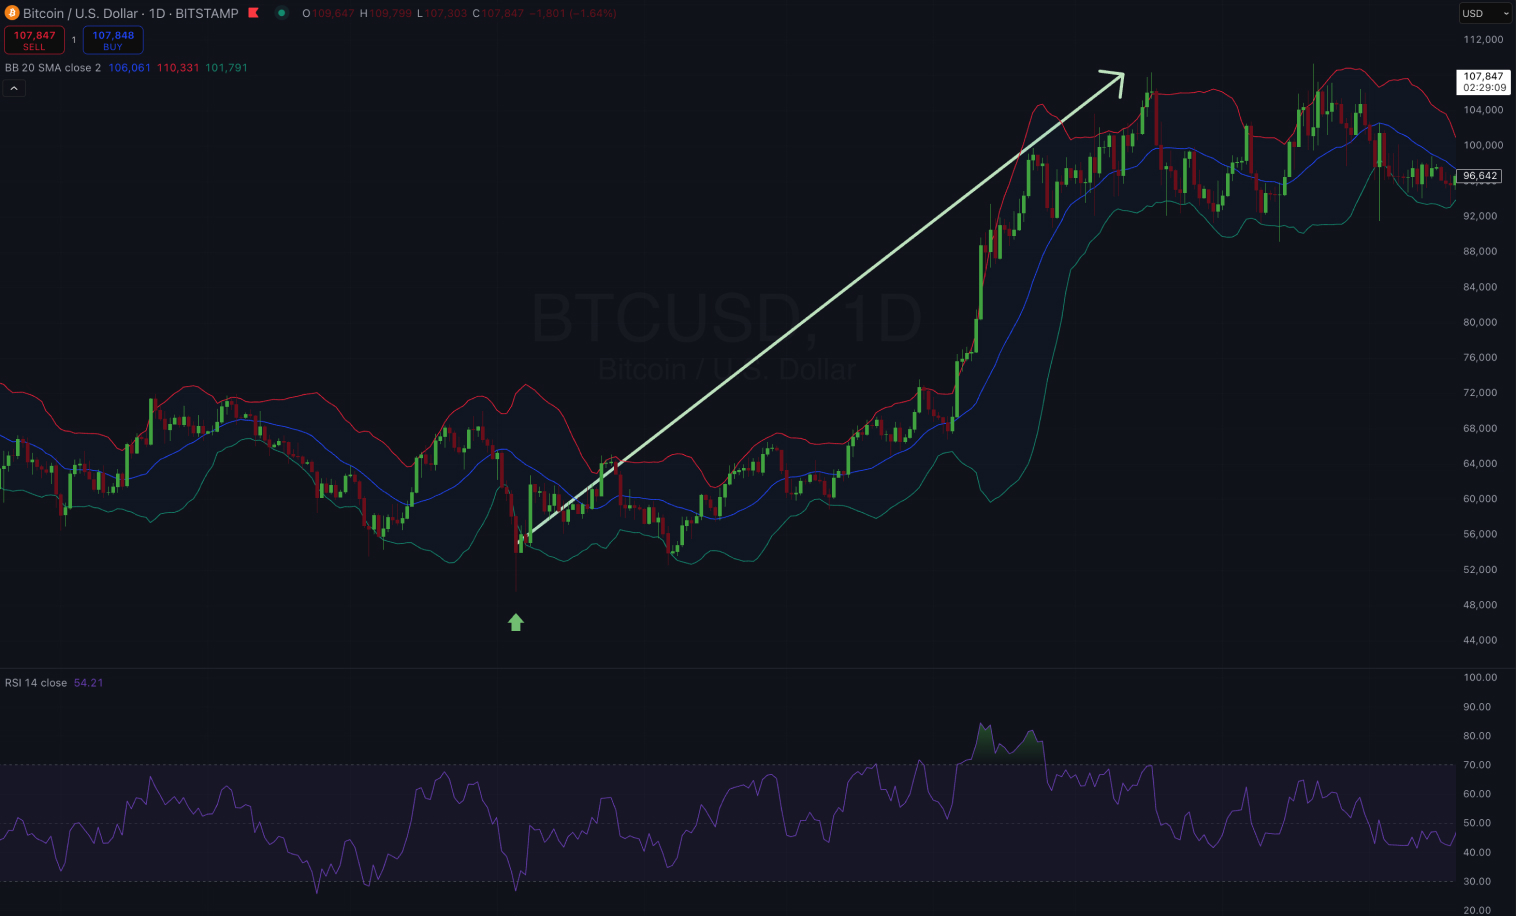
RSI & Bollinger Bands
This is a classic combination for identifying high-probability trades. A signal occurs when price touches or moves outside a Bollinger Band and the RSI confirms the momentum is exhausted by reaching the extremes at 30 or 70. This can help you identify reversals and profit when markets return to the mean.
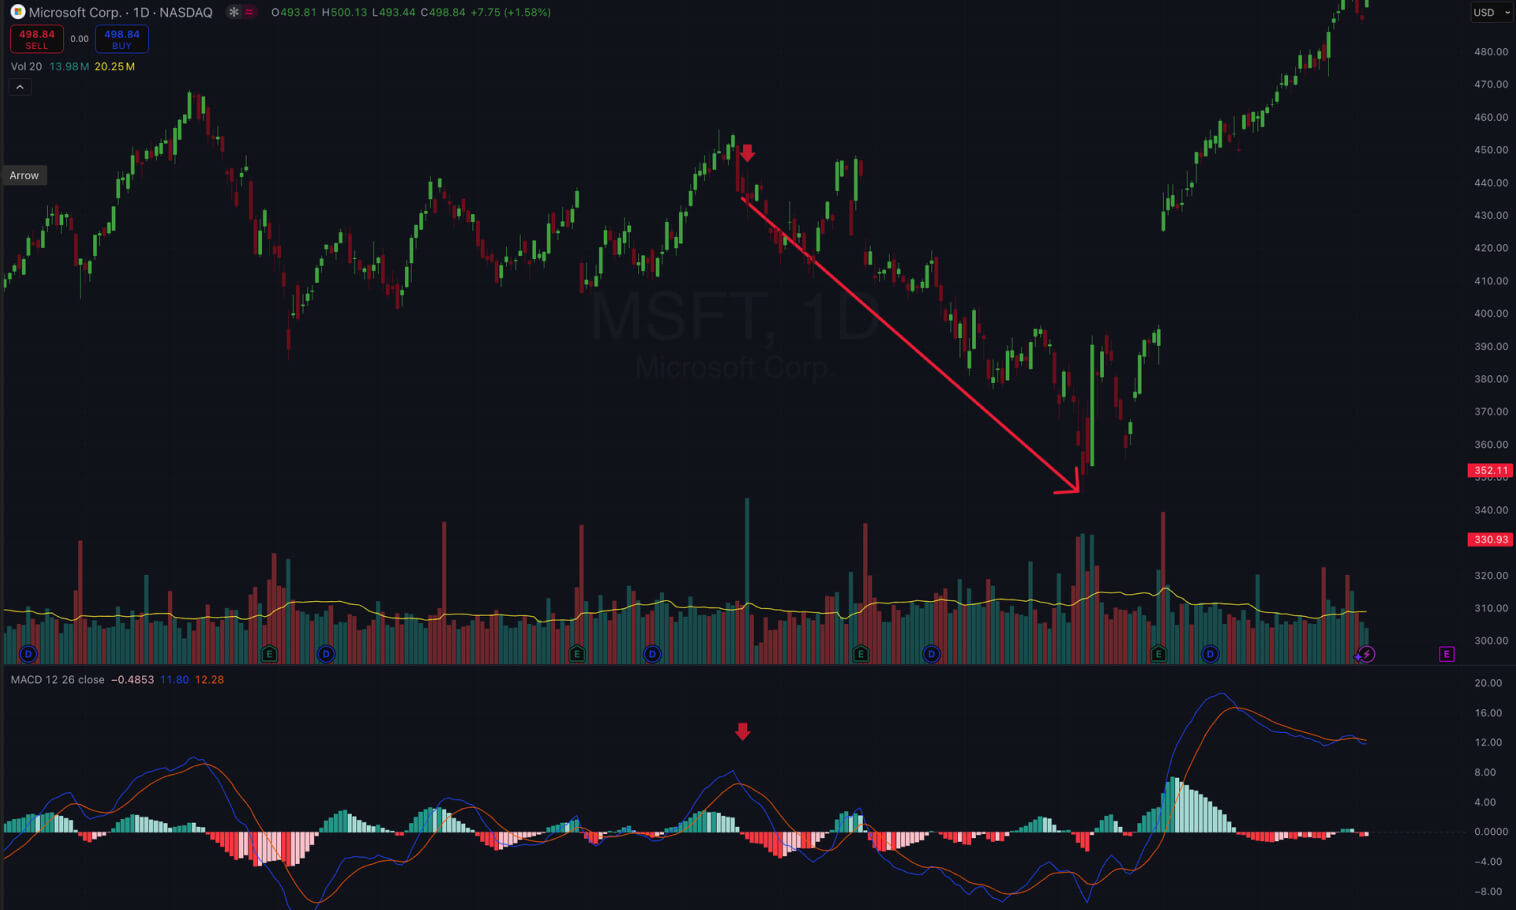
MACD & Volume
A MACD crossover signal is much more reliable when supported by a spike in trading volume. Higher-than-average volume indicates a larger participation behind any market move, making it less likely to be false.
PCR & OI
You can also use a combination of options-specific indicators to get a better grasp of the market. For example, a rising PCR and a rising OI on a down swing might confirm that the bearish movement has no real conviction behind it. You can use the RSI as a technical indicator to help define your entry point under this condition.
When different types of indicators give conflicting signals, it often means the market is in a state of uncertainty. The most prudent action in this case is to wait before taking any further action. A good strategy is to follow a hierarchical view of the analysis, where the primary trend holds the most weight. Considering a situation where the RSI is overbought but the MACD remains strongly bullish, it’s typically a sign of a powerful trend, not a reversal right away. Going short under these conditions would be extremely unwise until one of the indicators starts signaling a loss of momentum.
The main key to filtering out false signals is waiting for confluence. Do not act on a single signal. A multi-condition approach is the best way to ensure you’re trading based on a high-probability setup.
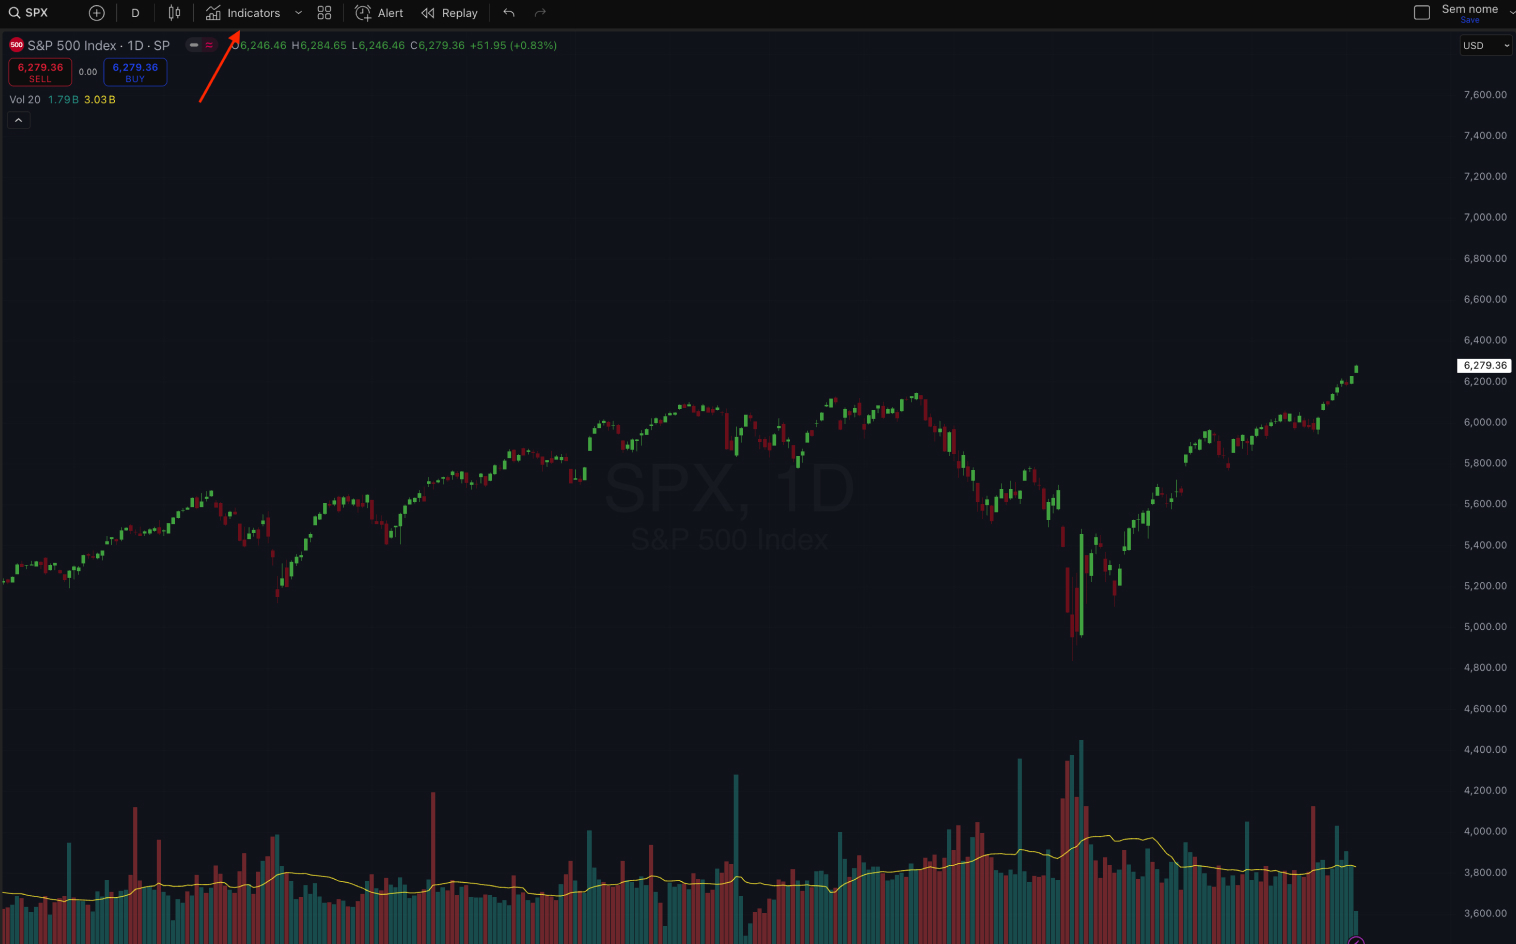
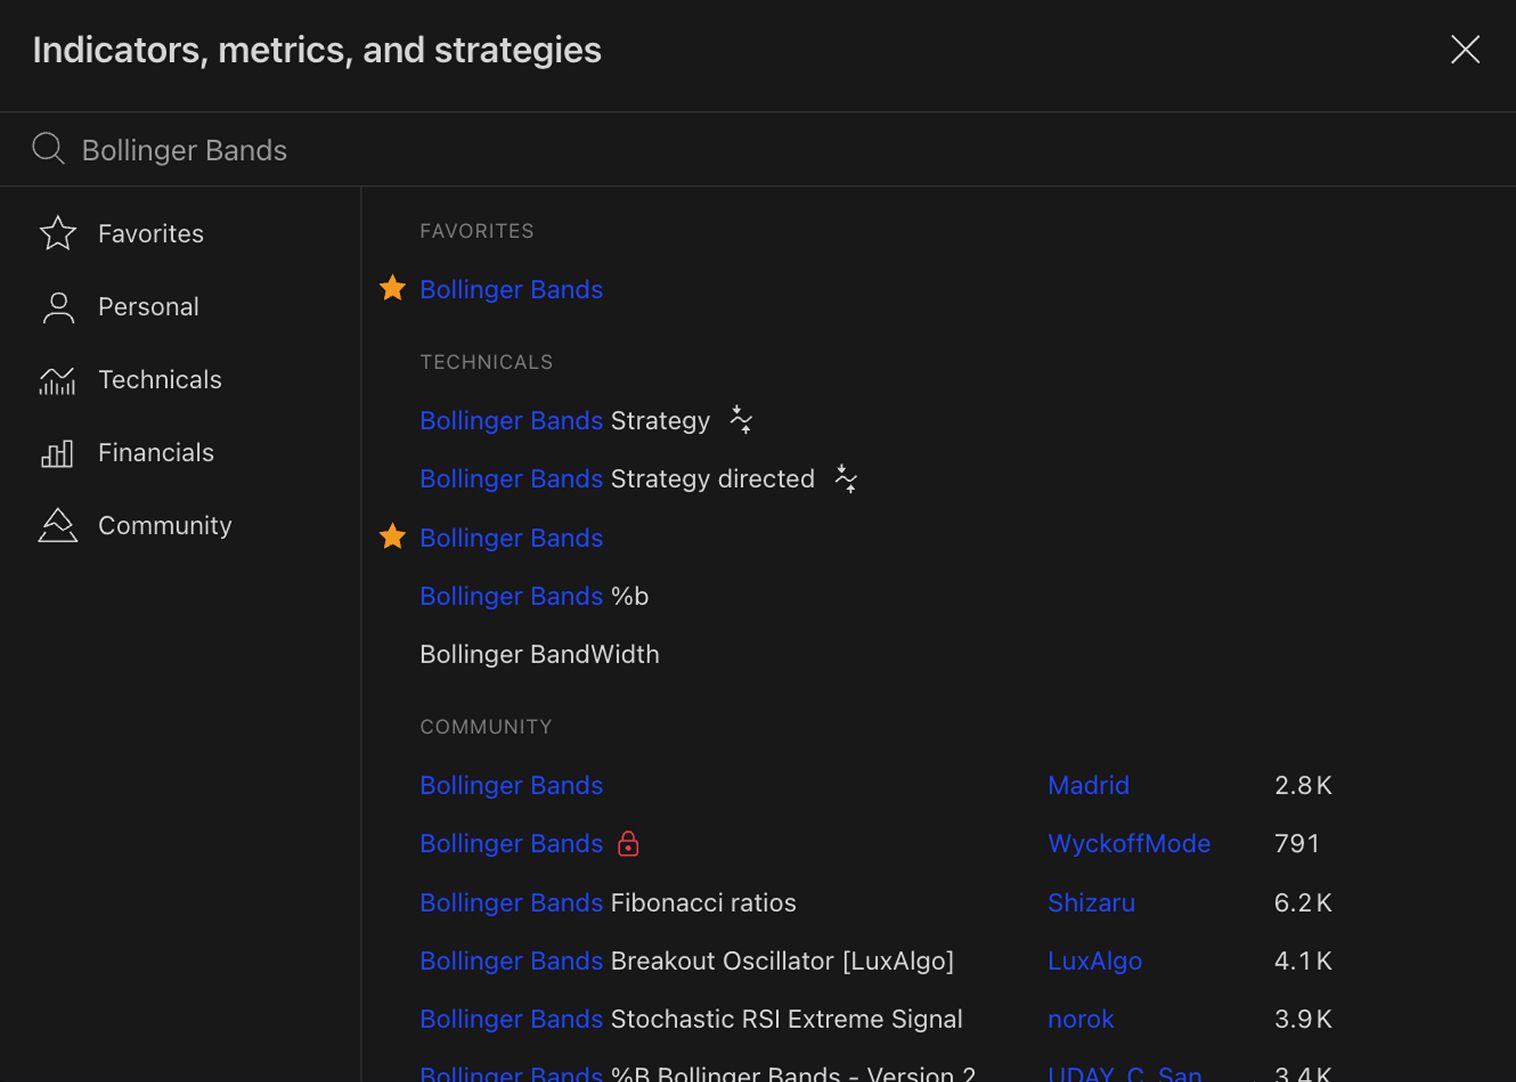
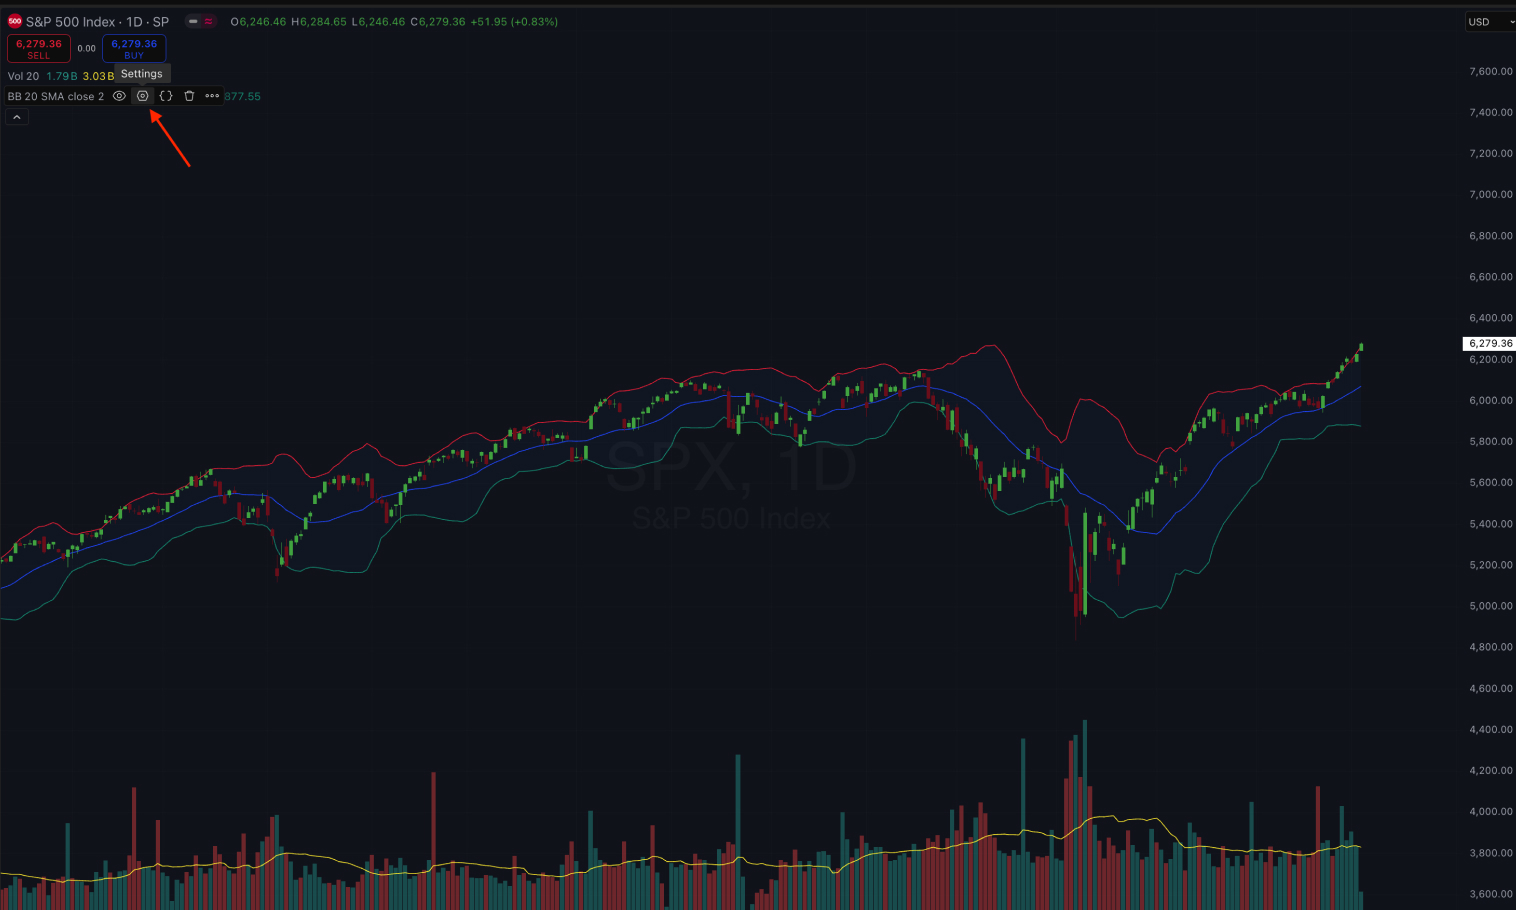
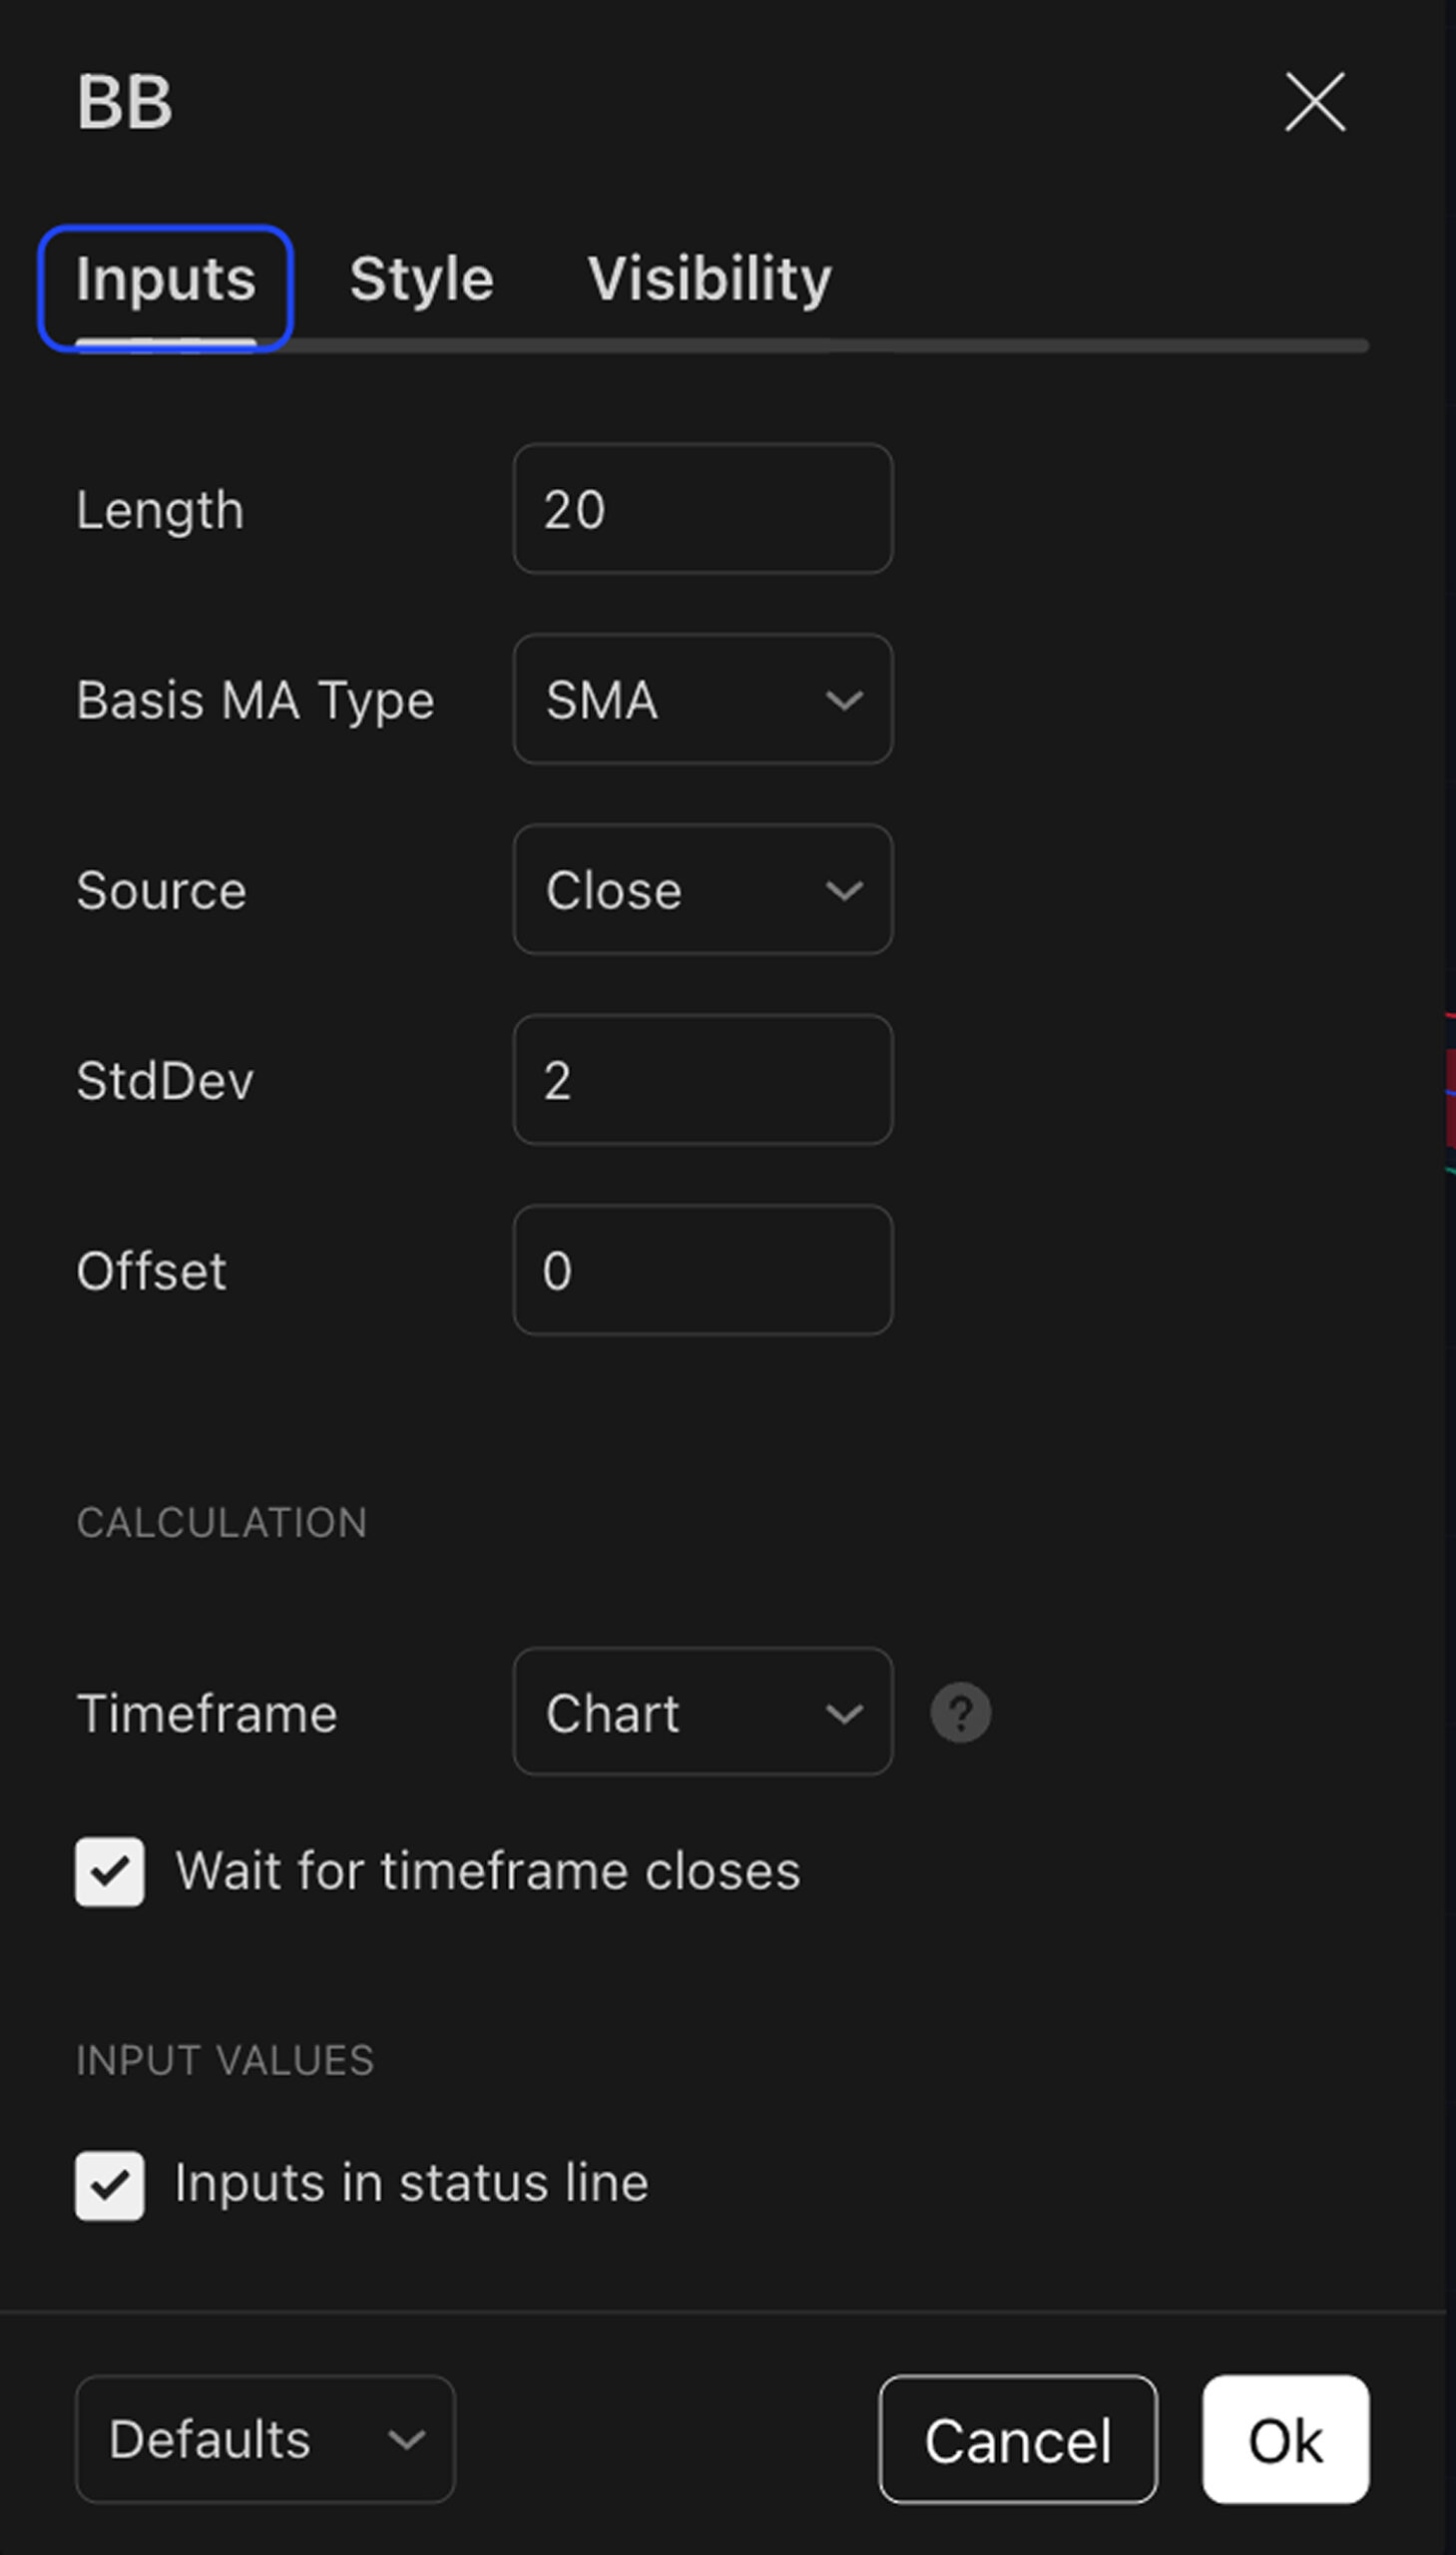
Modern trading platforms like TradingView make it extremely easy to add and customize indicators. In TradingView, you can find the Indicator menu at the top of your chart, search for the indicator you want to use and add it. To customize, you simply click the settings icon on the indicator’s title and a panel will show up where you can adjust several parameters, like period, colors, line thickness, visibility, etc.
It is important to highlight that there are no universal best settings. Optimal parameters are highly dependent on volatility levels and your trading style and strategy. It is also noteworthy that options traders have to watch for the option’s expiration, so the indicators must account for that additional factor.
How Indicators Help Traders with Risk Management
Besides finding entries, indicators help traders analyze risk and manage positions more effectively. A good approach to risk management is setting stop-losses based on the underlying asset’s price action instead of the option’s premium, which is distorted by the effects of time and volatility. The Average True Range provides a dynamic measure of volatility, so it is widely used by options traders.
For example, imagine you enter a long call position with the stock at $100 and the ATR at $1.50, your stop-loss on the stock would be placed at $97 based on the ATR, since $100 – (2 * $1.50) = 97. This method helps prevent premature exits caused by IV crush or theta decay. Volatility indicators can also help determine position size. In a high-volatility scenario, it is always prudent to reduce position size to account for the larger price swings.
Avoiding Common Mistakes
When trading options while using indicators based on technical analysis, one of the biggest mistakes is over-complication. Loading a chart with too many indicators will inevitably lead to conflicting signals, causing confusion and indecision. An optimal trading system would be made of 2 to 3 complementary, non-correlated indicators, such as one for momentum (RSI), one for trend (MACD), and one for volatility (Bollinger Bands).
Another mistake is ignoring the market context, especially implied volatility. An options trader might be correct about a stock’s direction but still lose money because they bought a call when IVR was at 95%, making the premium extraordinarily expensive. Always check IV Rank first. High IVR favors selling premium, while low IVR favors buying premium.
Traders also tend to misinterpret signals by using indicators in isolation or by applying inadequate settings for their timeframe. An indicator signal alone can’t be a complete trading system. Follow a methodical approach, where you have well-defined strategies, entry rules, exit rules for both profit and loss, and risk management for a better trading experience.
Final Thoughts
Using technical indicators for options trading is a bit different from using them for stock trading. When it comes to options, you must include the IVR to define a strategy, where selling premium when it is expensive and buying premium when it is cheap is the wise way to go. Besides classical technical analysis tools, you must also include the option Greeks to refine the structure of the trade and select the optimal strike prices and expirations.
Winning traders are those who can build a coherent, rule-based framework while leveraging the right combination of tools for the right conditions. This guide provides a starting point, but mastery can only come through practice, backtesting, and adapting these tools to fit your style and the market. Always remember that long-term survival in financial markets is based on constant learning, so never stop chasing new tools and concepts to add up to your trading toolkit.