Bollinger Bands
Many traders are already familiar with an indicator composed of one moving average plus an upper and a lower band surrounding it. These are the Bollinger Bands, a powerful technical analysis tool used in stock trading and created by John Bollinger back in the 1980s.
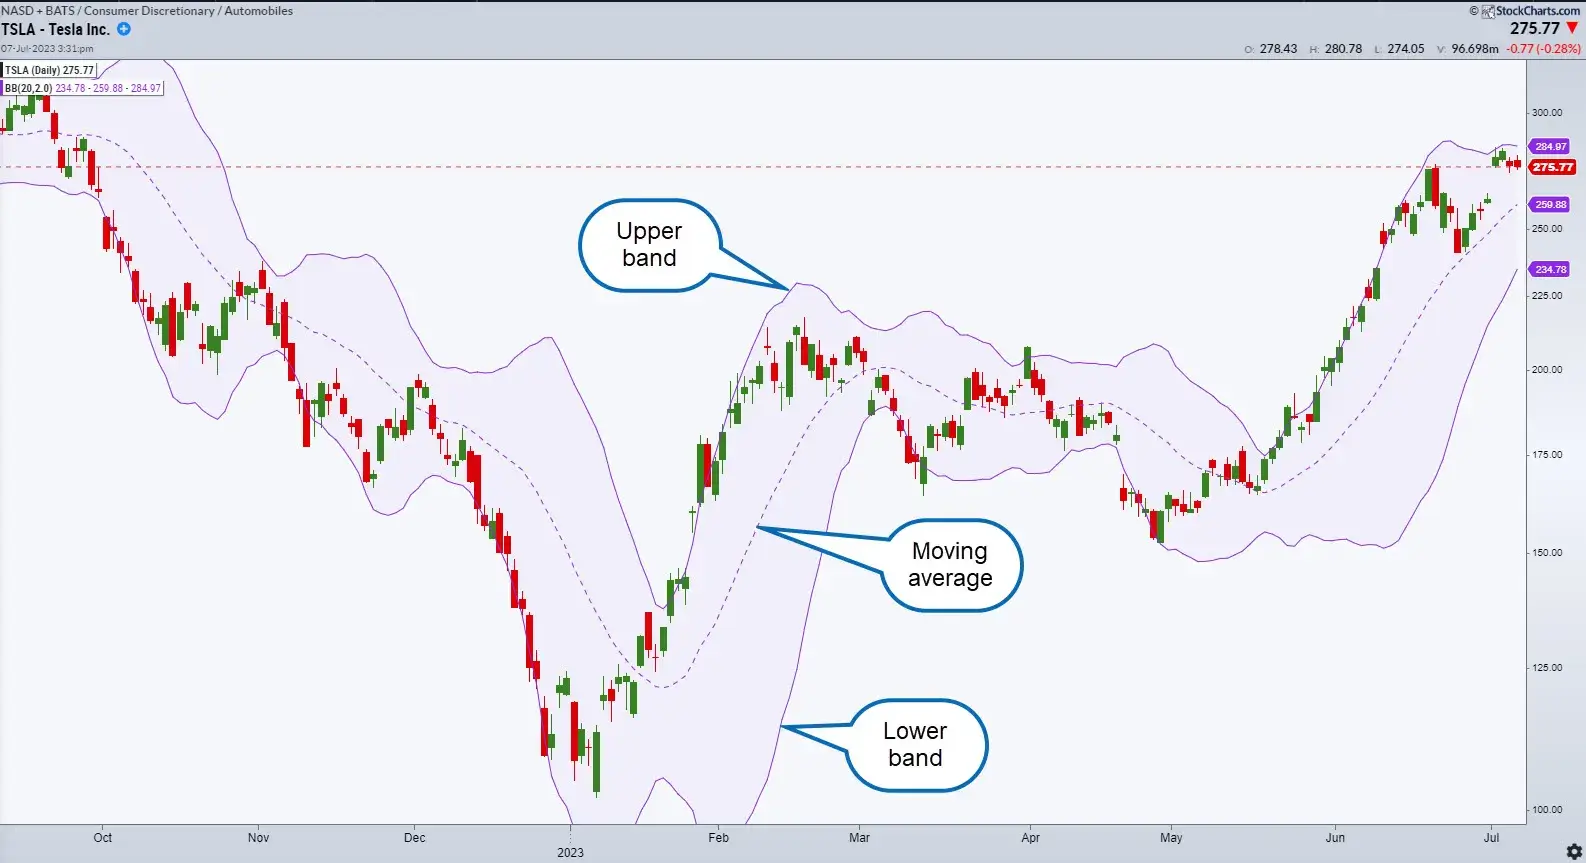
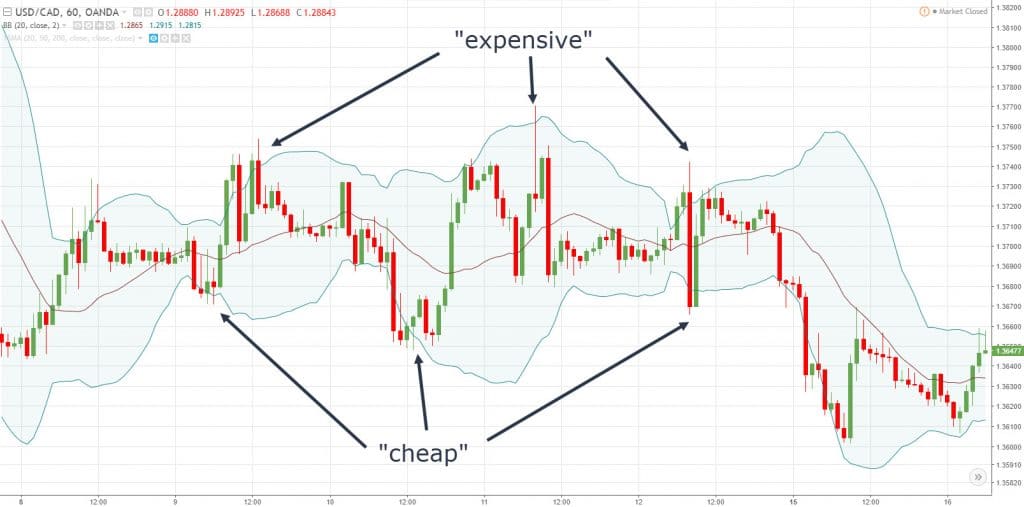
In principle, this indicator gives us visual insights into the dynamics of price based on a certain number of periods. You can see it in the picture below and identify its core components: upper band, middle band, and lower band. These lines help us find possible overbought or oversold levels, as well as identify whether we’re dealing with high or low volatility.
Understanding Bollinger Bands
Before diving into examples and strategies, we have to understand how this tool developed by John Bollinger works. Once you select the Bollinger Bands on your preferred trading platform, you will see a higher band, a lower band, and a line within these two bands. This middle line is a moving average—often a 20-day period simple moving average—and the upper and lower bands are placed at a distance of two standard deviations from the middle line.
The nature of the upper and lower bands helps us measure volatility in price movements. That’s because when prices become more volatile the bands widen, whereas low volatility makes them contract.
Some people also use the bands to find overbought and oversold levels. When prices touch the upper band, many traders open short positions expecting prices to reverse to the middle line or even reach the lower line.
Key Components of Bollinger Bands
The Bollinger Bands Indicator is one of the most famous indicators used in technical analysis to help people make trading decisions. But do you really know how it works? Let’s explore its key components to understand how this indicator can help us read market signals.
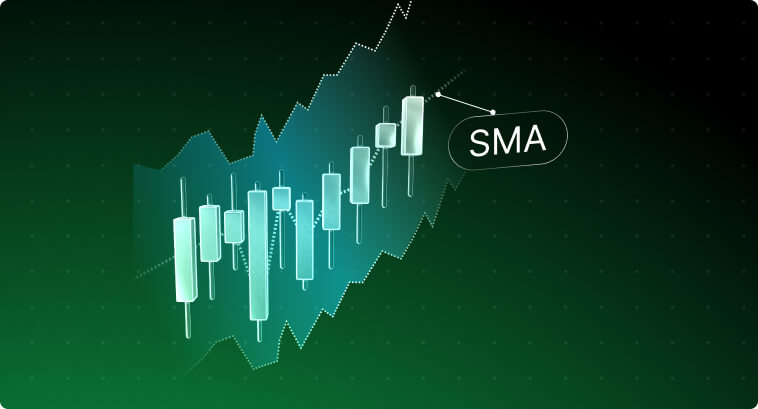
Simple Moving Average (SMA)
The middle line of the Bollinger Bands is just a simple moving average. That’s pretty straightforward.
It is the average closing price over the past 20 data points. Moving averages help smooth out noise in price data and also help us identify trends more easily. With each new data point, the simple moving average value will change, reflecting current price action while still taking into consideration past price action,
Upper and Lower Bands (Standard Deviation)
Both the upper and lower bands of the Bollinger Bands indicator are calculated based on the standard deviations from the simple moving average. The standard deviation is a metric in Statistics used to measure the dispersion/variability in price data. They provide a very quantifiable sense of the volatility.
Mathematically, the bands are calculated as:
- Upper Band = SMA + (Standard Deviation * Multiplier)
- Lower Band = SMA – (Standard Deviation * Multiplier)
The bands automatically adjust to the degree of volatility. Whenever volatility is high, the bands expand. When volatility is low, the bands contract.
The default multiplier is 2, which captures two standard deviations from the mean. You can, however, fine-tune the indicator and change that number according to the asset you’re trading and other market conditions.
How to Trade Using Bollinger Bands
Traders use several strategies to trade securities with Bollinger Bands. Some of them include:
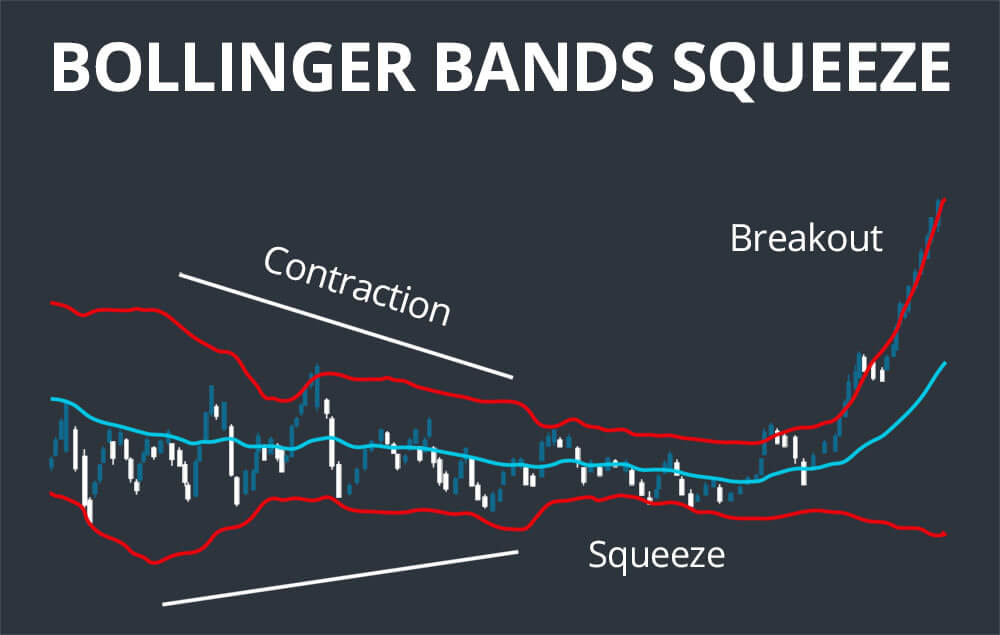
- Band Squeeze: Narrow bands indicate less volatility. This pattern is called the “Band Squeeze” and is often a sign that a breakout may be imminent—although it doesn’t indicate the direction of the breakout, prices may rise or fall. A closing data point outside the upper band with high volume can indicate the start of an explosive uptrend. The same is true when the opposite happens.
- Band Expansion: On the other hand, when prices move in explosive directions and the bands widen, it shows us that volatility is extremely high. Depending on your risk appetite and trading strategy, this scenario may offer opportunities for finding an entry point due to evidence that a strong trend is emerging. If you’re more cautious, it is a clear sign to stay out of the market, given the rise in volatility. By definition, most traders use additional indicators and patterns to ride these strong swings in stock prices.
- Band Borders: Some people may use the borders of the band as potential entry and exit points. During a strong uptrend, when prices are way higher than the upper band, most traders take this as a sign that the security is overbought and start developing a strategy to go short from that point. On the other hand, when prices touch the lower band during downtrends some people may start looking for an opportunity to go long. This trading strategy tends to be effective in shorter timeframes—such as intraday—and is a perfect example of how people may use technical indicators for scalping strategies.
- Double Tops and Bases: Double tops are formed when prices reach the upper band twice but fail to break above it, indicating resistance. A double base forms when the price reaches the lower band twice and fails to break below it, indicating a support level. Both can be strong indications that a trend reversal may eventually happen and are used to determine possible entry levels for riding this reversal.
Adapting Technical Indicators to Different Markets
Chart patterns may differ a lot from market to market. Given the peculiarities of each security, you might want to adapt how you use a tool like the Bollinger Bands and try different settings. From stocks to Forex, this is how you can adapt Bollinger Bands to get the best of it across different markets:
- Applications on Forex Markets: Considering that the Bollinger Bands can help you measure volatility quite well, it is no wonder that they’re used in the extremely volatile market of currency trading. Squeezes, more specifically, are very useful in Forex. Traders use periods of low volatility to stay vigilant and wait for a breakout to ride a new downtrend or uptrend.
- Applications on the Stock Market: When applied to stocks, Bollinger Bands can help us identify when a stock may be oversold or overbought. A touch at the upper band combined with declining values in volume indicators can be a hint that a stock is “expensive” and a correction might be imminent. Bollinger Bands can also be more effective in helping you identify double tops and double bases in stocks as they tend to display a more defined and predictable pattern of price action compared to markets such as Crypto.
- Applications on Crypto Marketing: Crypto trading, like Forex trading, is characterized by high volatility. Both the expanding and contracting nature of the bands can help identify moments of low and high volatility, allowing you to look for upcoming spikes in volatility and price. Of course, you have to be even more diligent in the crypto market. Bollinger Bands alone tend to not offer all the insights you need to accurately open positions.
Typical Mistakes of Trading with Bollinger Bands
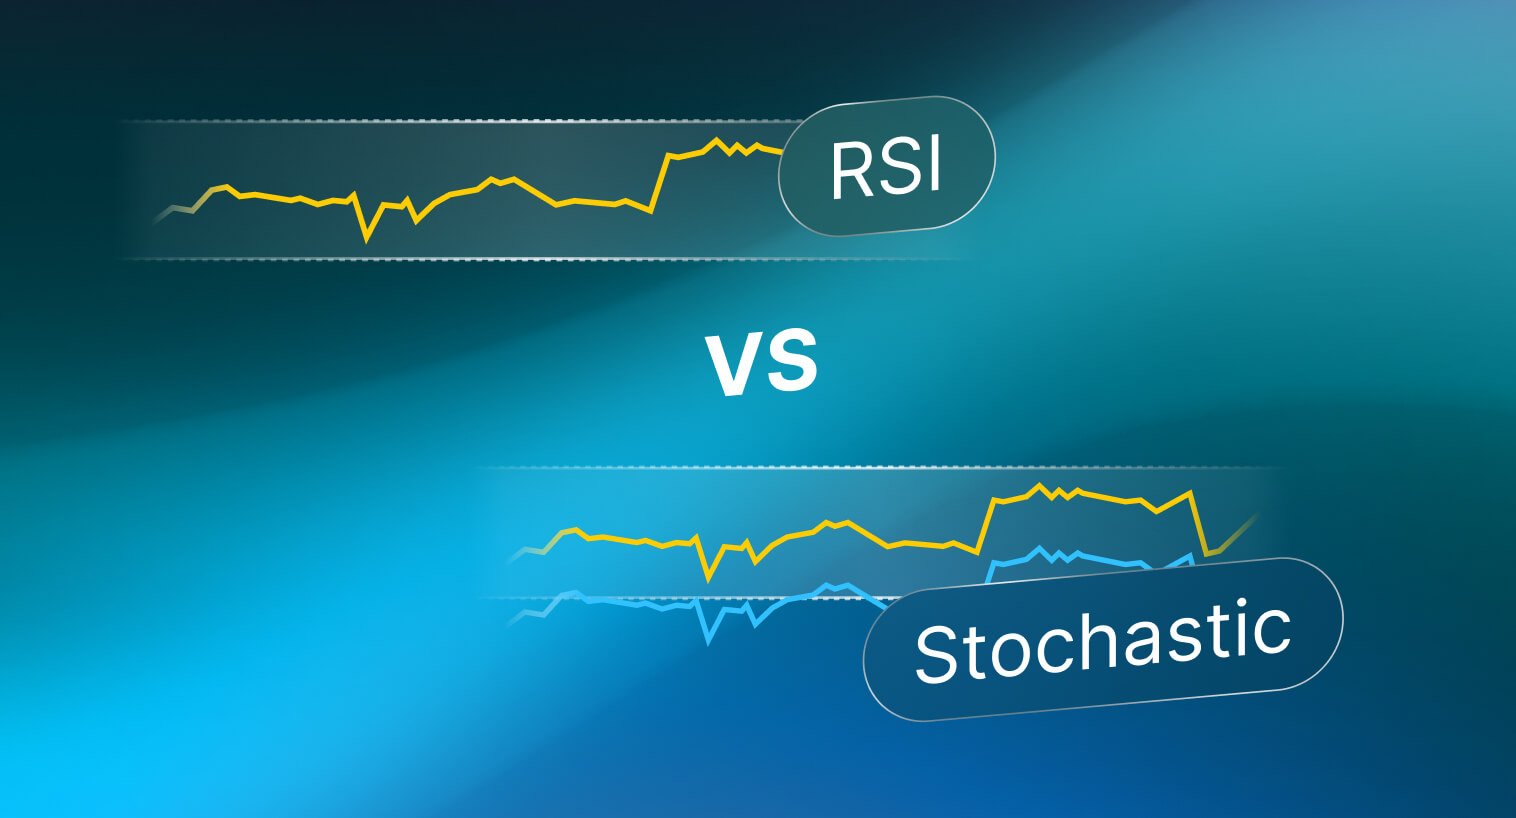
The first mistake that beginners make is assuming that touching the upper or lower bands automatically implies we’re going to have a trend reversal. This is hardly true all the time. When prices hit a band, it can indicate that we have a very strong trend, not necessarily exhaustion. Prices can consistently touch or exceed the upper band without reversing in a strong uptrend. Using RSI or MACD as confirmation tools can help beginners avoid betting on trend reversals when there’s no reason to believe one is about to happen.
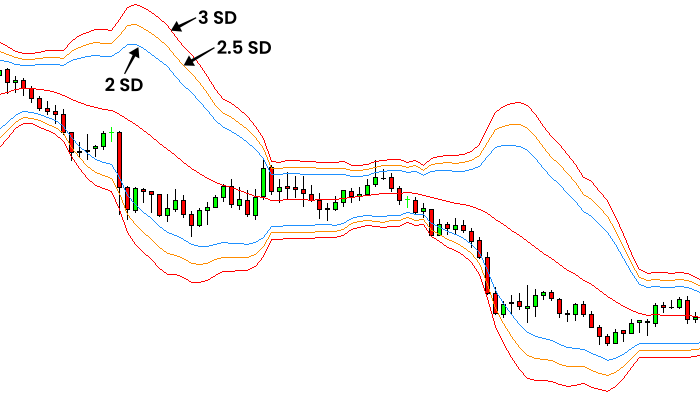
Another mistake is not adjusting the settings and trying different numbers of standard deviations. The standard settings of 20-period SMA and two standard deviations from the mean are probably not suited for every asset in the world. Some assets will probably benefit from a shorter 10-period SMA, different multipliers, or multiple standard deviations. In the image below we have an example of Bollinger Bands with three different standard deviation levels.
Another major issue is relying only on Bollinger Bands to place trades. Since Bollinger Bands are quite intuitive and straightforward, many beginners might end up believing that this indicator is all they need to succeed, which couldn’t be further from the truth. Bollinger Bands should always be combined with technical indicators like RSI, MACD, Volume Indicators, etc. Beginners should invest some time in learning the basics of technical analysis before going to live markets and learning the hard way (i.e., losing money).
Also, keep in mind that markets get extremely irrational during breaking news and relevant events. It is always a good idea to adjust the settings of the indicator when these events happen, you should definitely try different periods during strong trends. Different market conditions require different approaches, and beginners tend to find it harder to figure out when to adapt or stay out of the market completely.
Conclusion
The Bollinger Bands form an effective technical analysis tool developed by John Bollinger. It is intuitive and also useful, which explains why it is so popular. Since I first started in financial markets back in 2017, this indicator has been one of my favorites due to its versatility and reliability.
Bollinger Bands can help you identify buying and selling opportunities, analyze price behavior, and measure market volatility. They’re easy to adapt to different markets, from stocks to Forex, and you should definitely consider adding them to your toolkit.
To use this indicator effectively, focus on understanding its limitations and learning how to read it accurately. Be mindful that they don’t predict future prices and they should also be used with extra technical analysis tools.
You can benefit greatly from Bollinger Bands by developing a good understanding of market context, putting in some hours of practice, and including additional indicators in your analysis.