RSI Divergence Trading: Use the RSI Indicator to Improve Your Strategies
The Relative Strength Index Indicator
In 1987, J. Welles Wilder Jr.–an American mechanical engineer who became famous for his enormous contributions to technical analysis–introduced the Relative Index Strength indicator, also known as RSI.
The RSI is a momentum oscillator indicator that measures the speed and magnitude of price movements. It provides insights into whether a currency or asset is oversold or overbought, allowing you to buy or sell when markets irrationally take prices too low or too high.
Besides being used for several techniques, many traders use the RSI indicator to identify divergences and forecast potential reversals. RSI divergence happens when the movement in the indicator contradicts the movements you see in the price chart.
In this article, we will explore the concept of RSI divergence and walk through a step-by-step guide for detecting, interpreting, and making trading decisions effectively while using this technique.
Understanding RSI Divergence
The RSI is one of the best momentum indicators to measure the pace and intensity of the most recent changes in the price of an asset. Its values range from 0 to 100, helping you assess whether an asset is overbought (over 70) or oversold (below 30). This technical indicator reacts to price changes by comparing the average gains and losses over a specific time window, usually 14 periods, and usually moves alongside price (i.e., when prices go up, the RSI goes up).
Whenever there is a deviation in the correlation between price and indicator–prices going up while RSI goes down–we are potentially dealing with an RSI divergence.
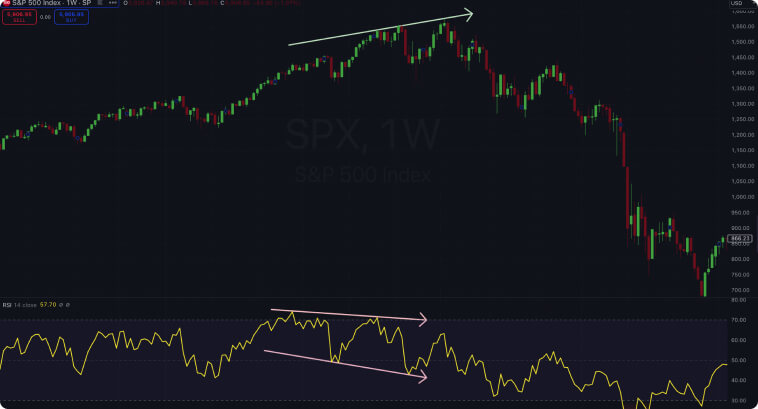
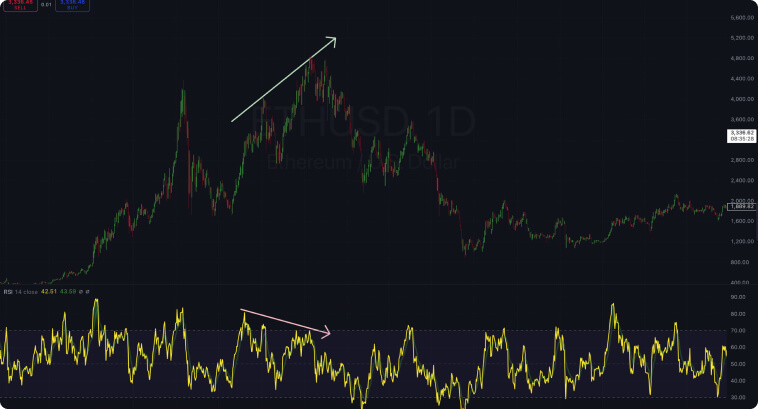
The image below provides a textbook example of divergence. Bitcoin prices appear to be in an uptrend, while the RSI indicator is trending downwards.
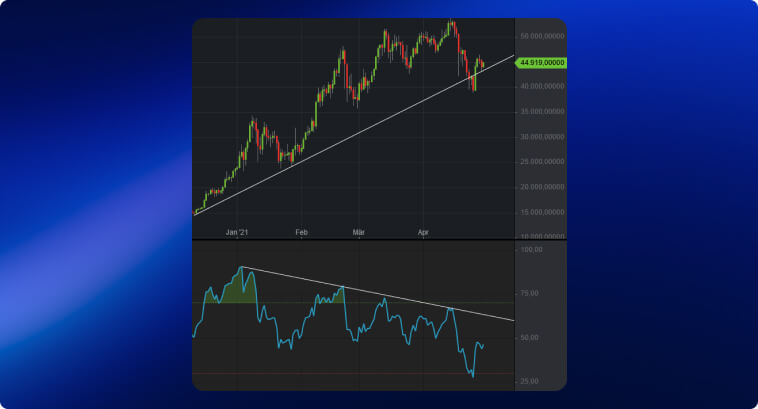
If an asset consistently makes higher highs while the RSI makes a lower low, it may point to a weakening uptrend. This divergence suggests that bears could gain momentum at any point, driving prices lower.
Types of Divergence
RSI divergences can fall into two main categories: Bullish and Bearish RSI divergence.
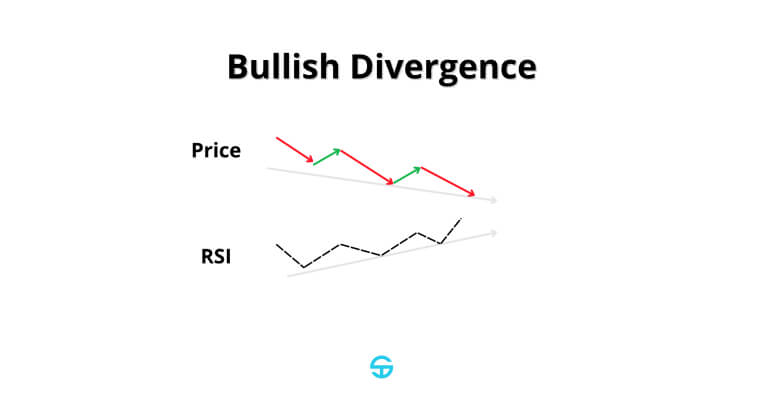
Bullish RSI Divergence
Bullish divergences occur when the price makes a lower low, but the RSI forms a higher lower.
This type of movement indicates that selling pressure is weakening, so the buy-side might gain enough strength to push prices higher and put an end to the downtrend.
It is more reliable when found at the bottom of a downtrend and aligned with oversold RSI levels.
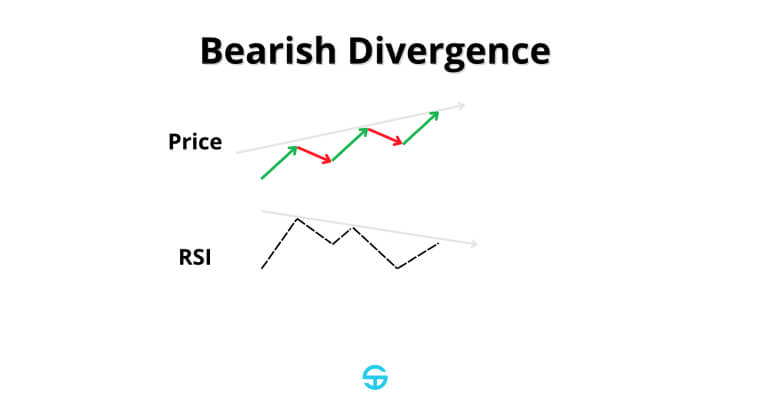
Bearish RSI Divergence
Bearish divergences, on the other hand, are marked by prices reaching a new high with lower highs on the RSI.
This divergence also points towards weakening strength among bulls, which empowers bears to take prices to lower levels and kickstart a downtrend.
This pattern is also more reliable when found at the peak of an uptrend and aligned with overbought RSI levels.
Finding Bullish RSI Divergences and Bearish Divergences
Spotting divergences on a price chart might not always be that straightforward. Not all divergences are relevant, either.
You can follow a similar approach to the one outlined below to enhance your chances of success when developing divergence-based trading strategies.
Bullish Divergence
• Identify a downtrend where bears/sellers have consistently pushed prices lower
• Pinpoint the lows in price and compare them with the lows on the RSI chart
• A bullish divergence occurs when prices form a lower low, but RSI forms a higher low.
• Attention: If divergence forms when RSI is at oversold levels–below 30–that can indicate that bulls/buyers might be at a key moment to seize control over the price.
Bearish Divergence
• Identify an uptrend where prices are consistently going up, forming higher highs and higher lows.
• Compare the price chart’s peaks with the peaks of the RSI values.
• If prices are reaching higher highs but the RSI forms a lower high, that is a sign of exhaustion of the uptrend.
• Attention: It is preferable that the divergence forms when RSI is under overbought conditions.
Trade RSI Divergences: RSI Indicator Setup for an Effective Strategy
The RSI indicator is available on most trading software nowadays. My number one choice is TradingView, where you can pick from a wide selection of built-in indicators, along with others developed by the trading community–you can see our blog post on the best TradingView indicators for day trading to explore a bit more on this topic.
On TradingView, you can simply look for “RSI” on the Indicators menu to find the built-in Relative Strength Index, which is very well done. You can change the colors of the RSI, use a moving average alongside it, and tweak it in any way you would like.
The main parameters to have in mind when adjusting the RSI to your liking are:
- RSI Period: By default, it is 14, which tends to be a good number for swing trading on the daily or weekly charts. A period ranging from 7 to 10 makes the indicator more sensitive to quick price movements, making it more suitable for intraday price action and volatile assets like crypto. For long-term investors, you might want to focus on an RSI period between 21 and 28 for smoother signals.
- Overbought and Oversold Levels: The default thresholds, which are suitable for most markets, are set at 70 for overbought and 30 for oversold. You can try adjusting these levels to 80/20 for more volatile scenarios like day trading Forex or crypto.
- Moving Average: The built-in indicator on TradingView comes with a 14-period simple moving average that you can use to smooth out the oscillator. Moving averages in this context can be used to filter out noise and provide extra confirmation signals for overbought and oversold levels. TradingViews offers the opportunity to use simple moving averages, exponential moving averages, and a simple moving average with Bollinger Bands, among many others. I highly suggest you try applying different types of moving averages onto your indicator to backtest scenarios and see if either of them would be a good fit for your trading style.
- Timeframe: Defining the right timeframe will depend on your trading style and goals. For scalpers, 2 to 5-minute intervals might provide good signals, although more noise. For swing trading, most would prefer a timeframe ranging from a couple of hours to a daily or weekly chart, whereas long-term investors might find good position strategies on a monthly chart. An optimal timeframe aligns with your risk tolerance and how frequently you’re monitoring the markets.
Good RSI Divergence Strategies
When used correctly, divergence trading can be extremely effective in getting in early on a trend reversal.
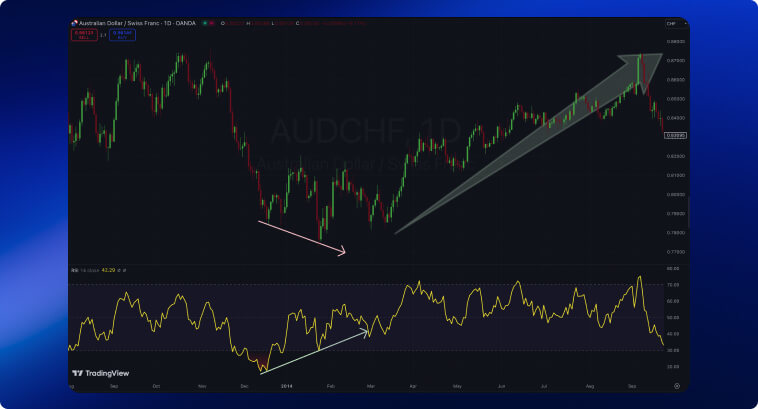
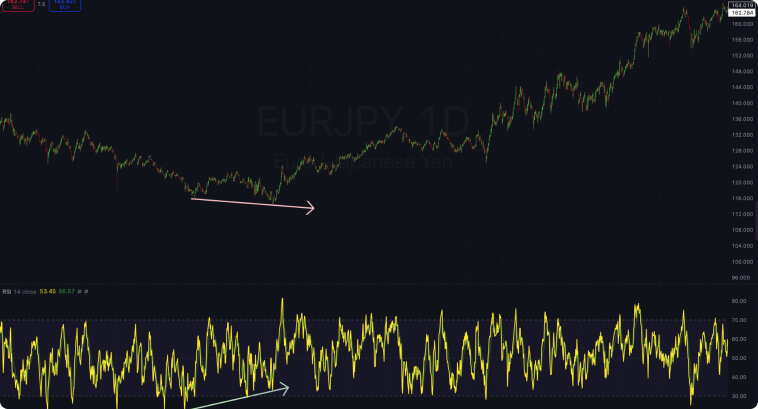
Considering that bullish divergences indicate an upward reversal, they offer you the opportunity to profit by going long when price action confirms that the buy-side took control over the trend and will drive the price to higher levels. Bullish divergences are spotted when the RSI forms higher lows while the price forms lower lows, pointing to diminishing selling pressure. The reversal can be confirmed via candlestick patterns like the bullish engulfing or hammer, serving as entry points.
The image below depicts an example of bullish divergence on the EURJPY currency pair. The pattern tends to be more reliable when it appears after a consistent decline in prices and when the RSI achieves an oversold level.
Bearish divergences, on the other hand, are designed to spot downward reversals. In this case, we are going short as soon as we have a confirmation that the sell-side took control over the price. We will look for a pattern where the price forms higher highs, but the RSI forms lower highs. Confirmation happens when a bearish candlestick pattern like the shooting star or bearish engulfing appears.
The example below shows a bearish divergence on the daily chart for Ethereum. Prices are in an uptrend until the RSI forms lower highs, indicating that bulls are losing their strength over the trend, taking prices down right after.
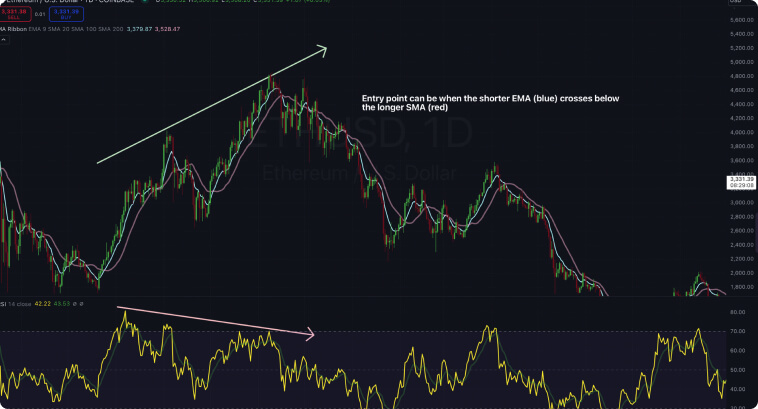
Divergence-based trading systems can become more accurate when combined with other technical techniques. Moving averages, for example, can help you define entry points (entry when a shorter moving average crosses up or down the longer moving average, depending on whether you’re looking at a bullish or bearish divergence)
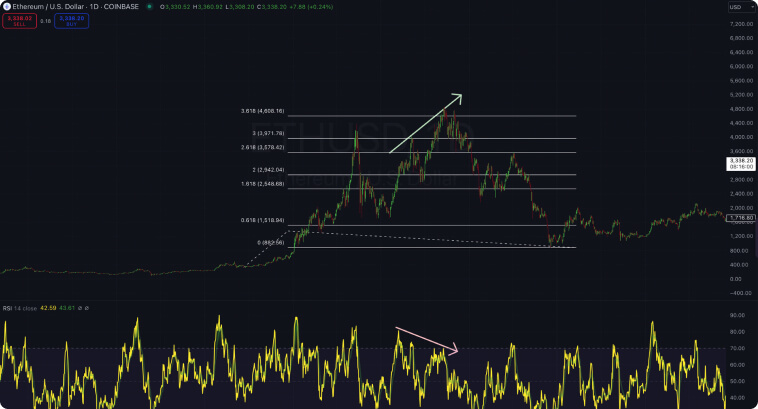
Fibonacci extensions or retracements can also help you identify relevant key points of support or resistance to help improve the analysis. For example, a divergence around relevant levels (e.g., 3.618) provides a good chance that the current trend has reached exhaustion, and the counterparty may have enough strength to push prices toward their direction.
Even though trading systems based on RSI divergences are powerful, they also tend to display false and unreliable signals. False divergences tend to occur in sideways markets or during periods of lower trading volume. Knowing how to filter out false signals is crucial to avoid entering trades way too early or in the wrong direction, which is why you can use the check-list below to help you asses when a divergence is truly relevant:
- Confirm that the divergence occurs within a trending market, as signals in consolidating markets are not trustworthy.
- Validate the divergence using additional indicators, such as moving averages, to ensure momentum aligns with the RSI’s reading.
- Analyze the trading volume. Strong reversals are often accompanied by a noticeable spike in volume.
- Prefer divergences that appear when RSI reaches oversold or overbought levels. To strengthen the signal, look for confluence with other technical tools, such as Fibonacci retracements/extensions or support and resistance levels.
Risk Management and Typical Mistakes When Trading with This Momentum Indicator
Risk management is the most important component of any trading system. Limit each trade to 1-2% of your total trading account and calculate position size based on stop-loss distance. Stop-loss should be set either below the lowest low for bullish divergences or above the highest high for bearish ones, for example. Profit targets can be around support and resistance levels, Fibonacci extension or retracement levels, or on a minimum risk-reward ratio such as 1:2.
Unfortunately, false signals are a common challenge. Avoid entering trades when the market is in consolidation, where no trend is apparent (you can use moving averages to help you identify that). Avoid any trade when volume is below average, as that indicates low interest from market participants, causing the prices to make erratic movements.
Typical mistakes come from misreading the RSI signals or relying solely on this indicator for confirmation. Not all divergences lead to reversals, so the broader context of the market should be taken into consideration before any entries. Trading volume, Fibonacci levels, support and resistance levels, and Bollinger Bands are your allies in identifying when a reversal is about to happen. Stay away from range-bound markets when trading divergence-based strategies.
Conclusion
RSI divergences are highly popular due to their effectiveness in identifying trend reversals, providing early signals of market shifts, and allowing you to ride the trend right from the start. Moving averages, Fibonacci retracements and extensions, plus volume analysis can help you improve reliability and maximize gains when developing a divergence-based trading system. For this particular strategy, focus on trending markets and combine trading signals with overbought and oversold RSI levels for better results.
Before risking your money, consider practicing on demo accounts to refine your skills and pair them up with a strong risk management plan. Use stop-loss and profit targets to maintain discipline and validate signals with the extra context of the market. The RSI divergence strategy can be a highly valuable component of any trading system when applied correctly.
While the RSI is widely applied in chart-based trading systems, several investors tend to consider the “bigger picture” before entering a position. To better understand how chart-based trading systems relate to and contrast with fundamental approaches, take a look at our article on technical vs fundamental analysis, as both can highly enhance your trading system and success.