Average Directional Movement Index: How to Use ADX Indicator and Trading Strategies

The Average Directional Index indicator, also known as the Average Directional Movement Index or simply ADX, is a directional indicator used to measure the strength of a trend. Although it doesn’t indicate the direction of the trend itself, it helps traders avoid a bad trade by pointing out when markets are weak and lacking in price action.
This tends to be a straightforward technical indicator to interpret. Overall, when the ADX is above 25 it suggests enough trend strength to enter the market. When the ADX is below 25 or 20, it suggests the market isn’t trending.
Before learning how to use the ADX indicator, we must understand how it works. This is the most important point before we start developing solid trading strategies with any technical analysis tool we intend to use. Let’s understand how the ADX measures the strength of trends and how to read it on a price chart.
The mind behind this indicator is J.Welles Wilders, a mechanical engineer who became famous due to the large contributions he left to Technical Analysis. Not only did he create the ADX indicator—which was introduced in the 1978 book, “New Concepts in Technical Trading Systems”— but he is also famous for creating the RSI, Average True Range, and Parabolic SAR.
The ADX indicator can be used in swing trading or day trading, and across several markets such as stock or Forex trading. Due to its versatility, it became a very popular indicator among traders.
The ADX value derives from the interaction between two lines: +DI and -DI. To summarize, +DI reflects Bullish sentiment in the market, while -DI reflects Bearish pressure. When put together, +DI and -DI can give an overview of the balance between buying and selling forces and how they’re driving prices.
ADX is derived from this interaction and can measure the overall strength of the trend, regardless of whether it is Bullish or Bearish. When ADX rises, we have trend strength, whereas a falling ADX indicates weakening momentum. The table below can serve as a guideline on how to measure trend strength by reading the ADX Indicator.
| ADX Value | Interpretation |
| 0-25 | No Trend |
| 26-50 | Strong Trend |
| 51-75 | Very Strong Trend |
| 76-100 | Extremely Strong Trend |
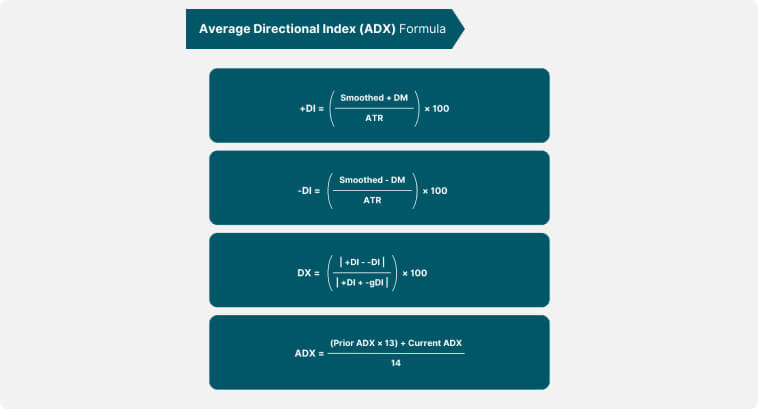
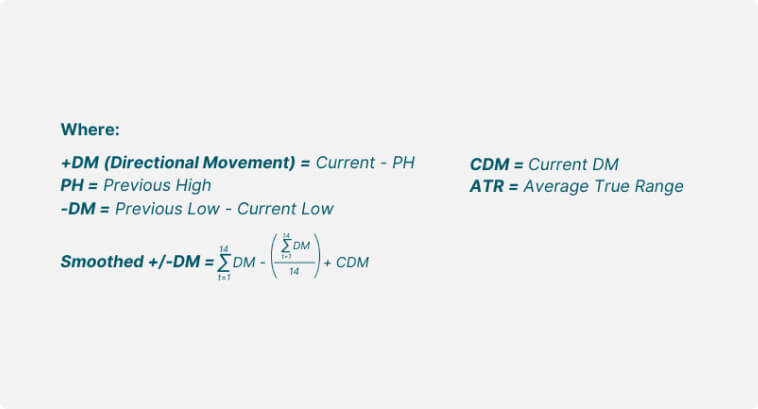
Calculating the ADX isn’t complex but it does involve a few steps. To summarize, the ADX value is the result of the difference between positive and negative directional movement indicators (+DI and -DI). That difference is then smoothed over a certain period. Let’s go through it step-by-step.
In case you need help visualizing the process better, you can use the image below as a reference for all the Mathematics involved in the calculations of this indicator.
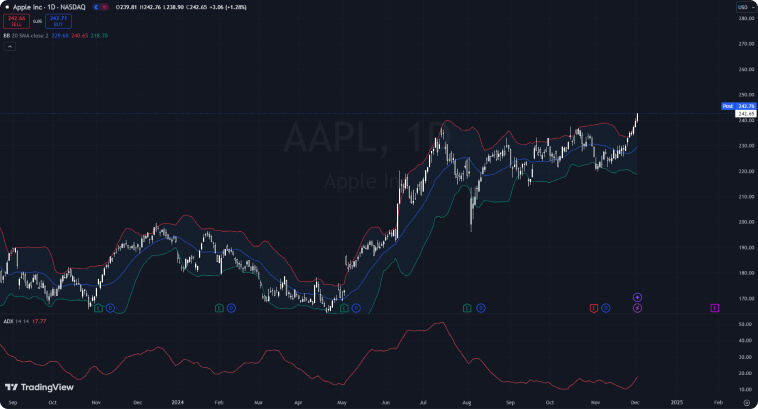
On trading platforms, this indicator can have different appearances. On some, you will see that the ADX is usually formed by three lines: The ADX line, the +DI line, and the -DI line.
On TradingView, as you can see in the image below, trading with the ADX indicator means you will only be seeing the main ADX line, with values ranging from 0 to 100, where values higher than 25 indicate the existence of a trend.
You can use ADX across different markets and approaches. You can use it for position trading or day trading. Whatever methodology or asset you prefer can benefit from this technical analysis indicator.
There is not a holy grail trading strategy, so there is no such thing as the perfect and most optimal ADX setting that will be useful for every single market condition. Even though the 14-period setting is the default, you can test shorter periods for intraday price action or highly volatile assets like cryptocurrencies.
For day trading strategies, testing shorter timeframes like the 5-minute or 15-minute charts is recommended, as well as testing different periods on these different timeframes.
Even though the main ADX Indicator on TradingView comes with only the ADX line, there are other versions of this indicator, mostly created by the trading community, where you can obtain more trading signals with some extra information on the screen. You can find the ADX and DI for v4 on the Indicators menu to have a version of the indicator that comes with a dashed line marking the 20-level value, plus the positive directional indicator (+DI) and negative directional indicator (-DI) alongside the ADX line.
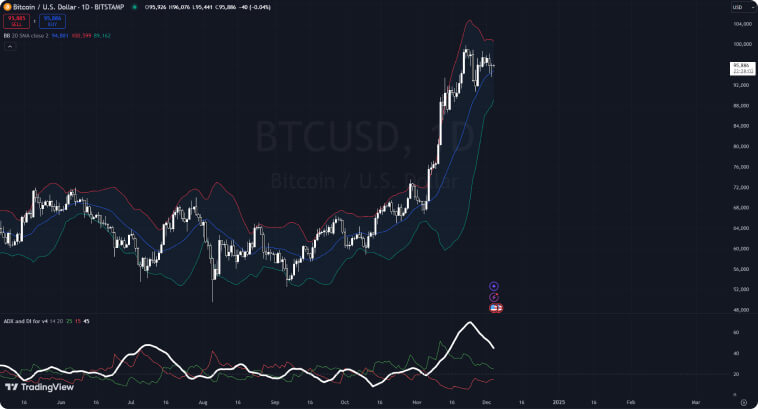
As previously mentioned, the most straightforward way of reading this indicator is considering that when it is below 20 the market isn’t on a trend. When the ADX is higher than 25, we might have a trend going on—regardless of direction.
Does it mean we only enter trades when the ADX is above 25? Not necessarily! Low ADX may suggest that the market is in the accumulation phase, preparing for an upcoming breakout that could lead to a trend. You might start opening positions during this phase depending on your risk appetite and experience.
Another common ADX strategy is using it to analyze divergences and convergence between the indicator and price action. If the price makes higher highs while the ADX falls, it may indicate a weakening trend strength and a possible reversal.
We can also use it as a momentum indicator, using the ADX line and the -DI and +DI crossovers to help us confirm whether a trend is winning or losing momentum. Crossovers, more specifically, provide significant signals for trading in the direction of momentum. When +DI crosses above -DI, we might have bullish momentum and an opportunity to go long. When -DI crosses above +DI, bearish momentum is increasing and we might have a chance of going short.
There are several effective trading strategies to employ with this indicator. Below, we will take a look at some of the best ADX indicator trading methods and see some real-world examples.
Overall, the ADX indicator is used for trend trading. Whenever the indicator suggests that there is a trend in the market, we open a position to ride along that trend. The most straightforward way ADX helps us is by going short or long whenever it rises above 20 or 25, confirming that a trend exists. You must combine the ADX with other indicators, such as a moving average, to help you confirm the direction of the trend.
Besides that, you can also use the ADX to identify divergence across the market. In the image below, we see a price chart for Apple Inc (AAPL). Starting in December 2023, prices were decreasing. Around March 6, 2024, the +DI—represented by the green line on the ADX chart—started to rise while prices were still falling. This is an indication that the market might be gearing up for an uptrend. Some traders would start opening up long positions here, during the accumulation phase.
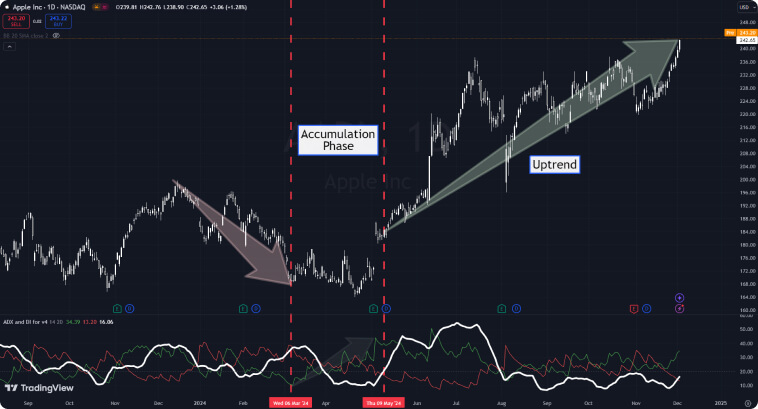
When the ADX line—the white, thicker line—rises above 20—the dotted grey line on the ADX chart—, we have a confirmation that the trend is gaining strength. Apple shares went into a Bullish trend, where buyers had more momentum than sellers. By the end of the period, you can see that the ADX line gets lower than 20 and prices start ranging from $236 to $196.
In the scenario above, traders who are prone to risk would probably open a long position during the accumulation phase, seeing that the +DI green line was making higher highs and crossed above -DI. Others, however, would only open a position when the ADX line raised above 20. It all depends on risk appetite and experience.
Given that risk management is an important part of making it in financial markets, I’d suggest most beginners await confirmation before opening a position. An even better approach would be combining ADX with other indicators.
ADX works even better when combined with other technical tools. Using trendlines or indicators like RSI combined with ADX provides more accuracy and confidence for our trading decisions.
Even though the ADX indicator helps us assess the strength of the trend, it doesn’t tell us the direction. In the image below you can see how moving averages can make it easier to decide whether you go long or short and when to enter the trade. When prices approach the 20-day moving average—blue line—and ADX still indicates we’re in a strong trend—above 25—, we have a good opportunity for entering a long position.
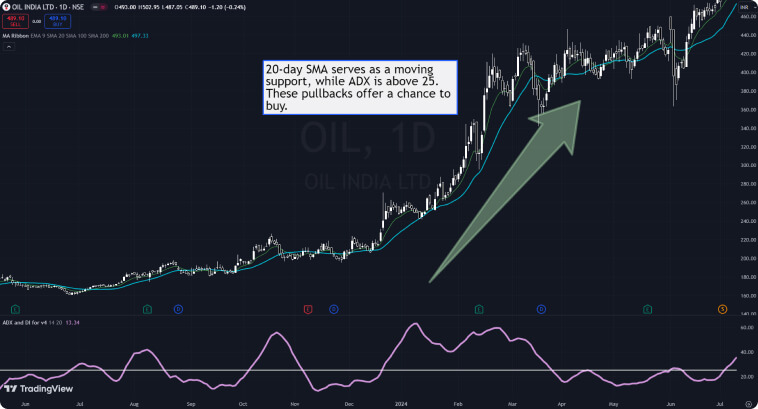
When ADX is below 25, prices start to move up and down over the moving averages, indicating a consolidation phase (i.e., no trend).
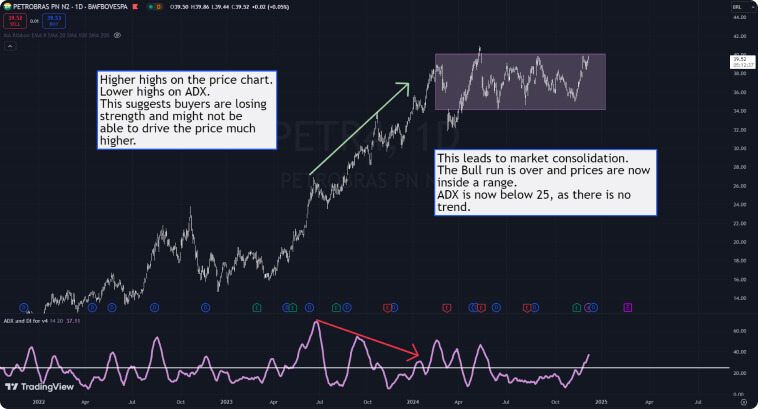
Some people also use trendlines on both the price chart and the ADX chart. This can be useful to identify divergences that can predict trend reversals or the deceleration of the trend. Even though prices were reaching higher highs in the image below, ADX was making lower peaks, indicating that buyers were losing strength. Even though this didn’t culminate in a trend reversal, it did lead to prices getting stuck in a price range, marking an end to the uptrend.
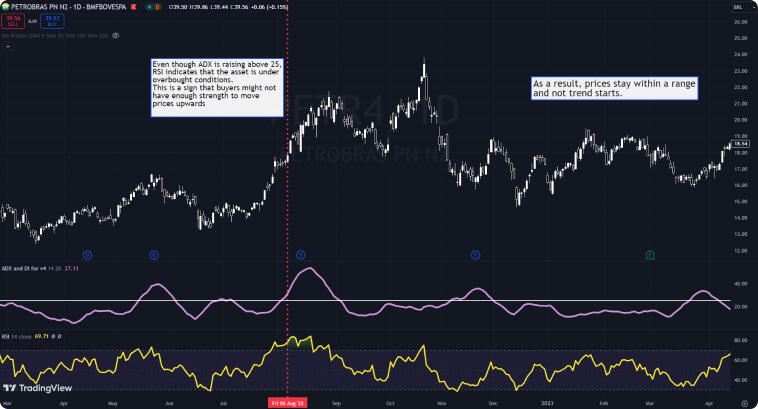
Using the RSI indicator alongside ADX also helps you avoid bad entries. In the example below, even though ADX rises above 25 and reaches a higher peak than the previous peak, the RSI tells us that prices are already in overbought territory. Even if ADX tells us that a trend is about to emerge, RSI indicates that buyers might not have enough power to drive prices much higher. This is exactly what happened! Even though the price reached a higher high, this didn’t lead to an explosive uptrend and the market stayed within a range.
Many traders, especially beginners, fail to understand that ADX is non-directional in essence, so it doesn’t tell us the direction prices are going. Some traders might wrongly assume that higher ADX may imply that buyers are driving prices upward or that lower ADX may imply the inverse, but this indicator simply measures trend strength, regardless of direction.
You can gain more insight into the direction of prices by adding additional trend indicators like moving averages. I find that the combination of two moving averages—a shorter exponential moving average and a longer simple moving average—works exceptionally well with ADX to identify pullbacks that allow you to enter a trend at a good price.
Using inappropriate settings can also lead you to bad decisions. If you like day trading, trying shorter periods is key to capturing signals that make sense in a shorter timeframe and higher volatility. In the image below, we have a 15-minute price chart with ADX set to 9 instead of 14. You can see how quickly the indicator captures the emerging downtrend.
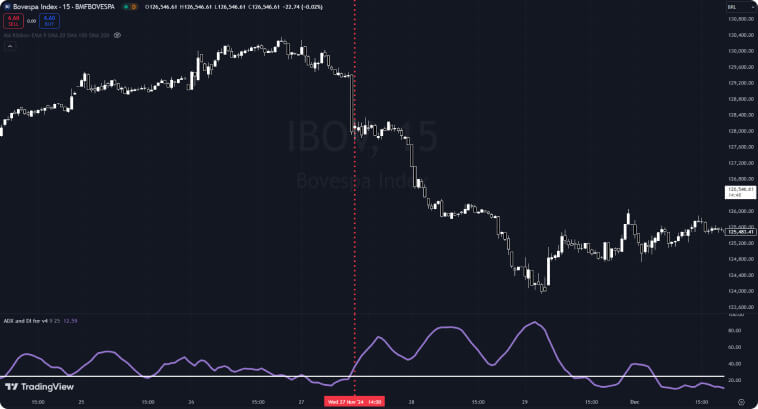
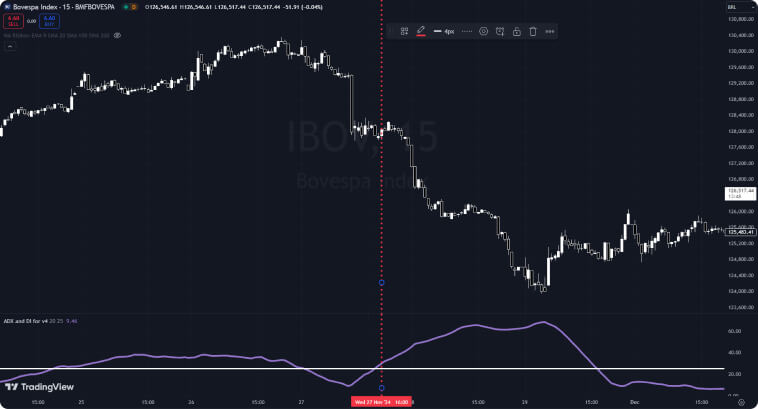
If we use a 20-period ADX, which is a good period for daily charts, you would have to wait 2 hours on this 15-minute chart to see ADX rising above 25, which is critical in fast-paced markets.
Since we are talking about the importance of adaptability, especially considering intraday price action, a good example of that is the 2-period ADX trading strategy.
In this case, traders use a 2-period instead of the default 14 and look for moments where ADX is below 20. That’s when the market isn’t trending and most traders expect an imminent breakout to occur.
In the example below, we can see prices on a 5-minute BTC/USD chart within a range until the moment that ADX falls below 20. Experienced day traders would already expect a breakout to happen at any moment. In this specific scenario, there are two methods to follow:
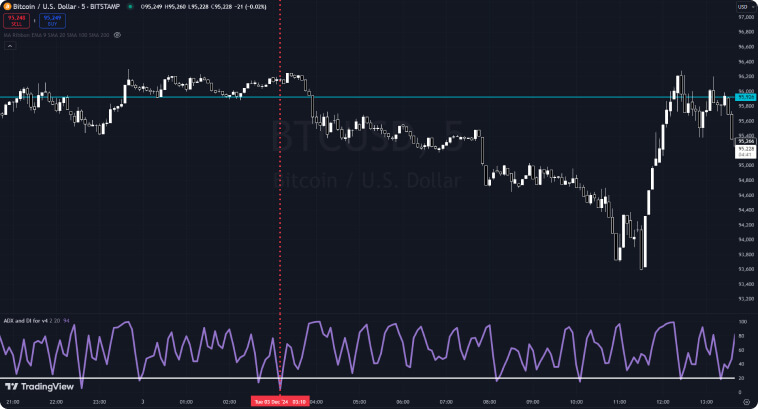
2. Use Bollinger Bands: By adding Bollinger Bands, you can clearly see the squeeze in that region, as soon as a breakout happens and the bands widen, you can go short and ride the trend until prices close above the upper band or higher than the middle band. By the way, notice that I’m also using a shorter-period moving average for my Bollinger Bands to adapt to intraday conditions.

Even though this strategy is more suited for those interested in fast-paced markets and methods like scalping in Forex or Crypto it still shows the importance of trying different settings and parameters for technical indicators to find the most optimal conditions for each asset and timeframe.
In this article, we did a walkthrough of several of the ADX indicator trading strategies, and how the calculation of the ADX works, among many other tips and examples that I hope were useful to help you understand how this powerful indicator can enhance your trading activities.
As with any other indicator, you have to ensure the best results for your trading account by using ADX inside a broader trading system. Combining ADX with other indicators and strategies can help you avoid false signals and losses. Adapting its parameters and settings to different markets can enhance its performance. Last, but not least, exercising diligent risk management can help you achieve long-term success in this highly competitive environment.
Now it is your turn to open your favorite trading platform and test the ADX indicator by yourself. Study how its lines behaved under different market conditions in the past. Try different settings to see how the indicator behaves. Develop your own strategies, backtest them, and adapt.
Stay curious!